Volvo 2009 Annual Report Download - page 102
Download and view the complete annual report
Please find page 102 of the 2009 Volvo annual report below. You can navigate through the pages in the report by either clicking on the pages listed below, or by using the keyword search tool below to find specific information within the annual report.-
 1
1 -
2
-
3
-
4
-
5
-
6
-
7
-
8
-
9
-
10
-
11
-
12
-
13
-
14
-
15
-
16
-
17
-
18
-
19
-
20
-
21
-
22
-
23
-
24
-
25
-
26
-
27
-
28
-
29
-
30
-
31
-
32
-
33
-
34
-
35
-
36
-
37
-
38
-
39
-
40
-
41
-
42
-
43
-
44
-
45
-
46
-
47
-
48
-
49
-
50
-
51
-
52
-
53
-
54
-
55
-
56
-
57
-
58
-
59
-
60
-
61
-
62
-
63
-
64
-
65
-
66
-
67
-
68
-
69
-
70
-
71
-
72
-
73
-
74
-
75
-
76
-
77
-
78
-
79
-
80
-
81
-
82
-
83
-
84
-
85
-
86
-
87
-
88
-
89
-
90
-
91
-
 92
92 -
 93
93 -
 94
94 -
 95
95 -
 96
96 -
 97
97 -
 98
98 -
 99
99 -
 100
100 -
 101
101 -
 102
102 -
 103
103 -
 104
104 -
 105
105 -
 106
106 -
 107
107 -
 108
108 -
 109
109 -
 110
110 -
 111
111 -
 112
112 -
113
-
114
-
115
-
116
-
117
-
118
-
119
-
120
-
121
-
122
-
123
-
124
-
125
-
126
-
127
-
128
-
129
-
130
-
131
-
132
-
133
-
134
-
135
-
136
-
137
-
138
-
139
-
140
-
141
-
142
-
143
-
144
-
145
-
146
 |
 |
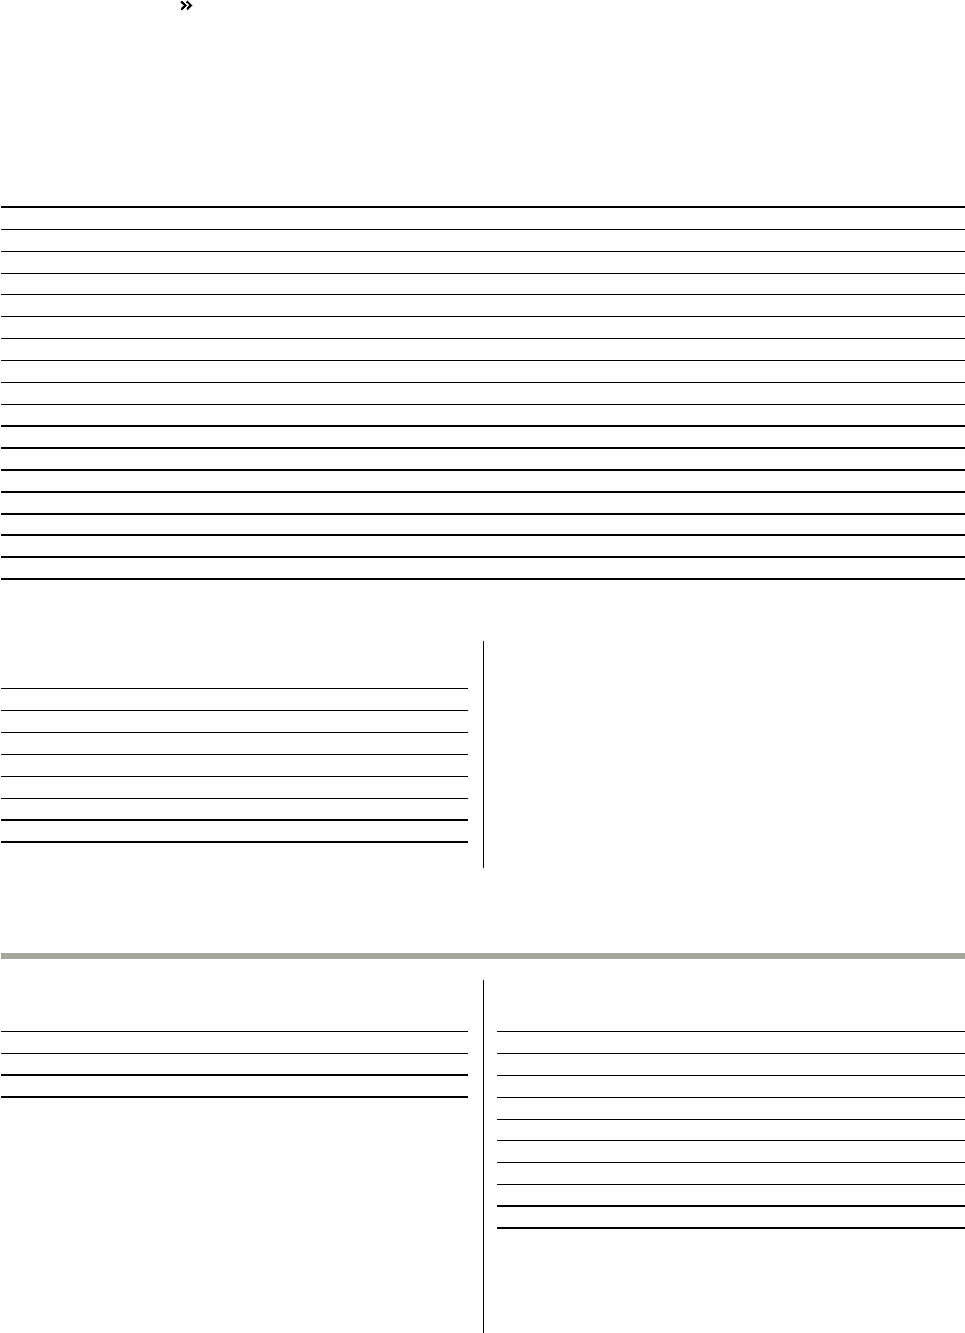
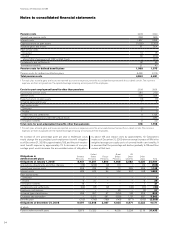
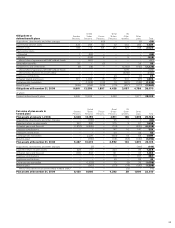
Notes to consolidated financial statements
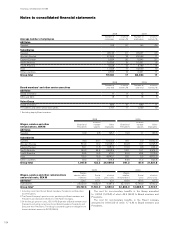
Other loans Actual interest rate,
Dec 31, 2009, % Effective interest rate,
Dec 31, 2009, % 2008 2009
USD 2004–2009/2011–2018 0.51–7.50 0.51–7.76 10,134 17,281
EUR 2006–2009/2011–2017 1.12–7.00 1.12–7.00 5,419 5,995
GBP 2008/2011–2013 0.96–7.28 0.96–7.05 1,952 1,664
SEK 2007–2008/2011–2017 0.63–1.96 0.63–1.97 3,778 2,684
CAD 2006–2008/2012–2013 0.80–1.01 0.80–1.02 2,712 2,067
MXN 2007–2009/2011–2014 4.99–9.06 5.11–9.45 1,197 2,145
JPY 2005–2009/2011–2016 0.77–3.71 0.77–3.71 17,076 16,374
CHF 2006/2011 0.61 0.61 735 696
BRL 2003/2017 6.58 6.86 2,994 5,940
Other loans 5.56–8.46 5.68–8.46 1,301 1,189
Total other non-current loans2 47,298 56,035
Deferred leasing income 2,508 1,965
Residual value liabilities 4,350 3,109
Accrued expenses service contracts 931 1,422
Other non-current financial liabilities 1,658 1,672
Other non-current liabilities 995 1,720
Total 93,538 115,114
2 Whereof loans raised to finance the credit portfolio of the customer financing operations 26,551 (34,955) and financial derivatives 769 (198).
Of the above long-term loans, 270 (374) was secured.
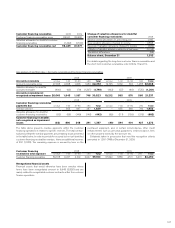
Long-term loans mature as follows:
2011 23,782
2012 22,824
2013 11,199
2014 19,020
2015 8,056
2016 or later 20,345
Total 105,226
See note 16 for maturities of long-term customer financing receivables.
Of other non-current liabilities the majority will mature within five
years.
At year-end 2009, credit facilities granted but not utilized and which
can be used without restrictions amounted to approximately SEK 33.2
billion (26.7). These facilities consisted of stand-by facilities for loans
with varying maturities through the year 2013. A fee is normally
charged for the unused portion of credit facilities and is reported in
the income statement under other financial income and expenses.
Note 27 Current liabilities
Balance sheet amounts for loans were as follows:
2008 2009
Bank loans 15,222 14,083
Other loans 47,409 37,543
Total162,631 51,626
1 Whereof loans raised to finance the credit portfolio of the customer
financing operations 40,766 (47,180) and derivatives 178 (604).
Bank loans include current maturities, 4,713 (4,701), of long-term
loans. Other loans include current maturities of long-term loans,
25,108 (26,336), and commercial paper, 8,640 (17,876).
Non-interest-bearing liabilities accounted for 70,955 (91,759), or
58% (59) of the Group’s total current liabilities.
Balance sheet amounts for Other current liabilities were as follows:
2008 2009
Advances from customers 3,352 3,556
Wages, salaries and withholding taxes 6,978 8,504
VAT liabilities 1,455 1, 511
Accrued expenses and prepaid income 14,307 11,756
Deferred leasing income 2,203 1,725
Residual value liability 2,138 2,730
Other financial liabilities 5,430 783
Other liabilities 4,534 3,540
Total 40,397 34,105
Current liabilities also include trade payables that amounted to 35,955
(51,025), current tax liabilities that amounted to 623 (1,204) and non
interest-bearing liabilities held for sale reported within Note 4.
Secured bank loans at year-end 2009 amounted to 329 (312). The
corresponding amount for other current liabilities was 58 (416).
FINANCIAL INFORMATION 2009
98