Volvo 2009 Annual Report Download - page 112
Download and view the complete annual report
Please find page 112 of the 2009 Volvo annual report below. You can navigate through the pages in the report by either clicking on the pages listed below, or by using the keyword search tool below to find specific information within the annual report.-
 1
1 -
2
-
3
-
4
-
5
-
6
-
7
-
8
-
9
-
10
-
11
-
12
-
13
-
14
-
15
-
16
-
17
-
18
-
19
-
20
-
21
-
22
-
23
-
24
-
25
-
26
-
27
-
28
-
29
-
30
-
31
-
32
-
33
-
34
-
35
-
36
-
37
-
38
-
39
-
40
-
41
-
42
-
43
-
44
-
45
-
46
-
47
-
48
-
49
-
50
-
51
-
52
-
53
-
54
-
55
-
56
-
57
-
58
-
59
-
60
-
61
-
62
-
63
-
64
-
65
-
66
-
67
-
68
-
69
-
70
-
71
-
72
-
73
-
74
-
75
-
76
-
77
-
78
-
79
-
80
-
81
-
82
-
83
-
84
-
85
-
86
-
87
-
88
-
89
-
90
-
91
-
92
-
93
-
94
-
95
-
96
-
97
-
98
-
99
-
100
-
101
-
 102
102 -
 103
103 -
 104
104 -
 105
105 -
 106
106 -
 107
107 -
 108
108 -
 109
109 -
 110
110 -
 111
111 -
 112
112 -
 113
113 -
 114
114 -
 115
115 -
 116
116 -
 117
117 -
 118
118 -
 119
119 -
 120
120 -
 121
121 -
 122
122 -
123
-
124
-
125
-
126
-
127
-
128
-
129
-
130
-
131
-
132
-
133
-
134
-
135
-
136
-
137
-
138
-
139
-
140
-
141
-
142
-
143
-
144
-
145
-
146
 |
 |

Notes to consolidated financial statements
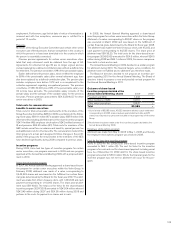
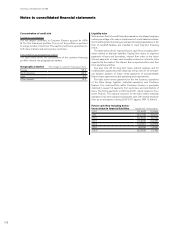
Concentration of credit risk
Customer concentration
The ten largest customers in Customer Finance account for 4.8%
(4.7) of the total asset portfolio. The rest of the portfolio is pertinent
to a large number of customer. This way the credit risk is spread across
both many markets and among many customers.
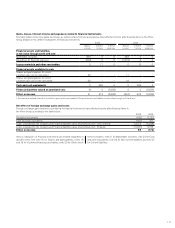
Concentration by geographical market
The table below shows the concentration of the customer financing
portfolio divided into geographical markets.
Geographical market Percentage of customer financing portfolio
Europe 53.4
North America 26.4
Asia 6.0
Other markets 14.2
Liquidity risks
Volvo assures itself of sound financial preparedness by always keeping a
certain percentage of its sales in liquid assets. A sound balance between
short- and long-term borrowing, as well as borrowing preparedness in the
form of overdraft facilities, are intended to meet long-term financing
needs.
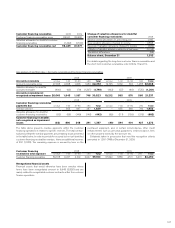
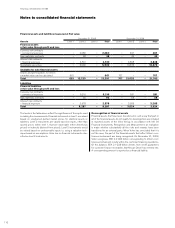
The table below shows expected future cash-flows including deriv-
atives related to financial liabilities. Capital flow refers to expected
payments of loans and derivatives. Interest flow refers to the future
interest payments on loans and derivatives based on interests rates
expected by the market. The interest flow is reported within cash flow
from operating activities.
See also note 26 for long-term loans maturity analysis and for
credit facilities granted but not utilized as well as note 31 for contract-
ual duration analysis of future rental payments of noncancellable
finance lease agreements and operating lease agreements.
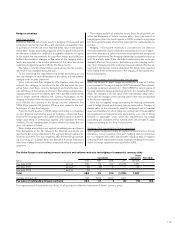
The table below shows payments for the two business operations
of the Volvo Group together, Industrial operations and Customer
finance. The credit portfolio within Customer Finance is principally
matched in respect of payments from customers and amortization of
loans. The future payments in 2010 and 2011 mainly relates to Cus-
tomer Finance. The maturity structure for the loans within Industrial
operations has been advanced during the year with limited amortiza-
tions as a consequence during 2010-2011 (approx. SEK 12 billion).
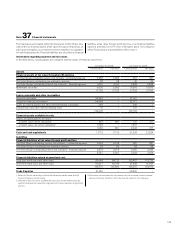
Future cash-flow including deriva-
tives related to financial liabilities Capital flow Interest flow
2010 (51,493) (5,586)
2011 (23,735) (4,597)
2012 (22,836) (4,105)
2013 (10,463) (3,235)
2014 (19,831) (2,089)
2015 (8,085) (1,285)
2016– (20,435) (1,148)
FINANCIAL INFORMATION 2009
108