Volvo 2009 Annual Report Download - page 93
Download and view the complete annual report
Please find page 93 of the 2009 Volvo annual report below. You can navigate through the pages in the report by either clicking on the pages listed below, or by using the keyword search tool below to find specific information within the annual report.-
 1
1 -
2
-
3
-
4
-
5
-
6
-
7
-
8
-
9
-
10
-
11
-
12
-
13
-
14
-
15
-
16
-
17
-
18
-
19
-
20
-
21
-
22
-
23
-
24
-
25
-
26
-
27
-
28
-
29
-
30
-
31
-
32
-
33
-
34
-
35
-
36
-
37
-
38
-
39
-
40
-
41
-
42
-
43
-
44
-
45
-
46
-
47
-
48
-
49
-
50
-
51
-
52
-
53
-
54
-
55
-
56
-
57
-
58
-
59
-
60
-
61
-
62
-
63
-
64
-
65
-
66
-
67
-
68
-
69
-
70
-
71
-
72
-
73
-
74
-
75
-
76
-
77
-
78
-
79
-
80
-
81
-
82
-
 83
83 -
 84
84 -
 85
85 -
 86
86 -
 87
87 -
 88
88 -
 89
89 -
 90
90 -
 91
91 -
 92
92 -
 93
93 -
 94
94 -
 95
95 -
 96
96 -
 97
97 -
 98
98 -
 99
99 -
 100
100 -
 101
101 -
 102
102 -
 103
103 -
104
-
105
-
106
-
107
-
108
-
109
-
110
-
111
-
112
-
113
-
114
-
115
-
116
-
117
-
118
-
119
-
120
-
121
-
122
-
123
-
124
-
125
-
126
-
127
-
128
-
129
-
130
-
131
-
132
-
133
-
134
-
135
-
136
-
137
-
138
-
139
-
140
-
141
-
142
-
143
-
144
-
145
-
146
 |
 |

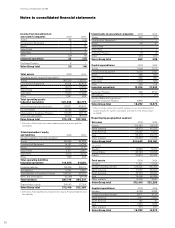
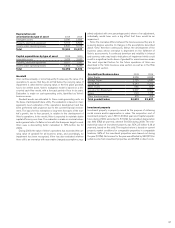
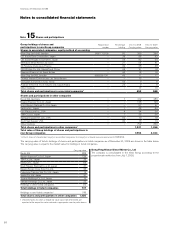
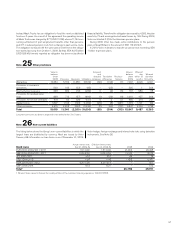
Changes in the Volvo Group’s holdings of shares and participations: 2008 2009
Balance sheet, December 31, preceding year 2,219 1,953
Change in Group structure (88) (15)
Acquisitions and divestments, net 16 45
Write-downs of associated companies (33) (48)
Capital contribution 56 2
Share of income in associated companies 15 12
Revaluation of shares to fair value (546) 92
Translation differences 325 (74)
Dividends (7) (21)
Re-classification of holdings of Volvo Technology Transfer – 80
Other (4) 18
Balance sheet, December 31 1,953 2,044
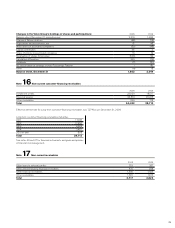
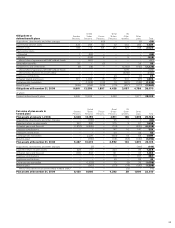
Note 16 Non-current customer-financing receivables
2008 2009
Installment credits 23,029 18,517
Financial leasing 26, 874 20,478
Other receivables 529 718
Total 50,432 39,713
Effective interest rate for Long-term customer-financing receivables was 7.27% as per December 31, 2009.
Long-term customer-financing receivables maturities
2011 17,918
2012 11, 9 54
2013 6,526
2014 2,457
2015 or later 858
Total 39,713
See notes 36 and 37 for financial instruments and goals and policies
in financial risk management.
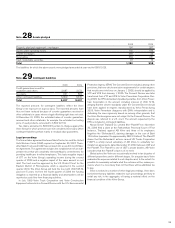
Note 17 Non-current receivables
2008 2009
Other loans to external parties 219 287
Other interest-bearing financial receivables 475 298
Other financial receivables 1,382 1,425
Other receivables 1,641 1,613
Total 3,717 3,623
89