Travelers 2013 Annual Report Download - page 98
Download and view the complete annual report
Please find page 98 of the 2013 Travelers annual report below. You can navigate through the pages in the report by either clicking on the pages listed below, or by using the keyword search tool below to find specific information within the annual report.-
 1
1 -
2
-
3
-
4
-
5
-
6
-
7
-
8
-
9
-
10
-
11
-
12
-
13
-
14
-
15
-
16
-
17
-
18
-
19
-
20
-
21
-
22
-
23
-
24
-
25
-
26
-
27
-
28
-
29
-
30
-
31
-
32
-
33
-
34
-
35
-
36
-
37
-
38
-
39
-
40
-
41
-
42
-
43
-
44
-
45
-
46
-
47
-
48
-
49
-
50
-
51
-
52
-
53
-
54
-
55
-
56
-
57
-
58
-
59
-
60
-
61
-
62
-
63
-
64
-
65
-
66
-
67
-
68
-
69
-
70
-
71
-
72
-
73
-
74
-
75
-
76
-
77
-
78
-
79
-
80
-
81
-
82
-
83
-
84
-
85
-
86
-
87
-
 88
88 -
 89
89 -
 90
90 -
 91
91 -
 92
92 -
 93
93 -
 94
94 -
 95
95 -
 96
96 -
 97
97 -
 98
98 -
 99
99 -
 100
100 -
 101
101 -
 102
102 -
 103
103 -
 104
104 -
 105
105 -
 106
106 -
 107
107 -
 108
108 -
109
-
110
-
111
-
112
-
113
-
114
-
115
-
116
-
117
-
118
-
119
-
120
-
121
-
122
-
123
-
124
-
125
-
126
-
127
-
128
-
129
-
130
-
131
-
132
-
133
-
134
-
135
-
136
-
137
-
138
-
139
-
140
-
141
-
142
-
143
-
144
-
145
-
146
-
147
-
148
-
149
-
150
-
151
-
152
-
153
-
154
-
155
-
156
-
157
-
158
-
159
-
160
-
161
-
162
-
163
-
164
-
165
-
166
-
167
-
168
-
169
-
170
-
171
-
172
-
173
-
174
-
175
-
176
-
177
-
178
-
179
-
180
-
181
-
182
-
183
-
184
-
185
-
186
-
187
-
188
-
189
-
190
-
191
-
192
-
193
-
194
-
195
-
196
-
197
-
198
-
199
-
200
-
201
-
202
-
203
-
204
-
205
-
206
-
207
-
208
-
209
-
210
-
211
-
212
-
213
-
214
-
215
-
216
-
217
-
218
-
219
-
220
-
221
-
222
-
223
-
224
-
225
-
226
-
227
-
228
-
229
-
230
-
231
-
232
-
233
-
234
-
235
-
236
-
237
-
238
-
239
-
240
-
241
-
242
-
243
-
244
-
245
-
246
-
247
-
248
-
249
-
250
-
251
-
252
-
253
-
254
-
255
-
256
-
257
-
258
-
259
-
260
-
261
-
262
-
263
-
264
-
265
-
266
-
267
-
268
-
269
-
270
-
271
-
272
-
273
-
274
-
275
-
276
-
277
-
278
-
279
-
280
-
281
-
282
-
283
-
284
-
285
-
286
-
287
-
288
-
289
-
290
-
291
-
292
-
293
-
294
-
295
-
296
-
297
-
298
-
299
-
300
-
301
-
302
-
303
-
304
 |
 |
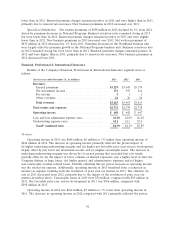
above. Catastrophe losses in 2012 were $794 million, compared with $1.02 billion in 2011. Net favorable
prior year reserve development in 2012 was $467 million, compared with $245 million in 2011.
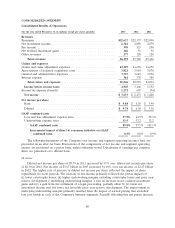
Revenues
Earned Premiums
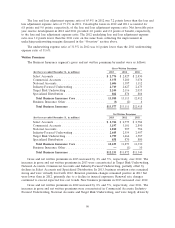
Earned premiums in 2013 were $12.08 billion, $393 million or 3% higher than in 2012. Earned
premiums in 2012 were $11.69 billion, $364 million or 3% higher than in 2011. The increases in both
years primarily reflected the impact of increases in net written premiums over the preceding twelve
months.
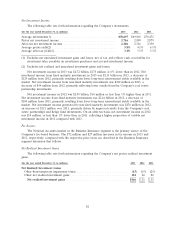
Net Investment Income
Net investment income in 2013 was $1.98 billion, $115 million or 6% lower than in 2012. Net
investment income in 2012 was $2.09 billion, $49 million or 2% higher than in 2011. Refer to the ‘‘Net
Investment Income’’ section of the ‘‘Consolidated Results of Operations’’ discussion herein for a
description of the factors contributing to the changes in the Company’s consolidated net investment
income in 2013 and 2012 compared with the respective prior years. In addition, refer to note 2 of notes
to the Company’s consolidated financial statements herein for a discussion of the Company’s net
investment income allocation methodology.
Fee Income
National Accounts is the primary source of fee income due to its service businesses, which include
claim and loss prevention services to large companies that choose to self-insure a portion of their
insurance risks, as well as claims and policy management services to workers’ compensation residual
market pools. Fee income in 2013 increased by $71 million or 22% over 2012. Fee income in 2012
increased by $27 million or 9% over 2011. The increases in both years primarily reflected higher
serviced premium volume in workers’ compensation residual market pools and higher claim volume in
the large deductible business.
Other Revenues
Other revenues in 2013 included a $91 million gain from the settlement of a legal proceeding,
which is discussed in more detail in note 16 of notes to the consolidated financial statements.
Claims and Expenses
Claims and Claim Adjustment Expenses
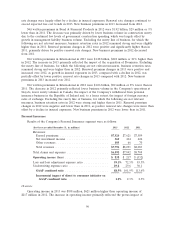
Claims and claim adjustment expenses in 2013 were $7.58 billion, $281 million or 4% lower than in
2012, primarily reflecting (i) a decline in catastrophe losses and (ii) the impact of a modest decline in
volumes of insured exposures, partially offset by (iii) the impact of loss cost trends and (iv) a decrease
in net favorable prior year reserve development. Catastrophe losses in 2013 were $285 million,
compared with $794 million in 2012. Net favorable prior year reserve development in 2013 was
$325 million, compared with $467 million in 2012. Factors contributing to net favorable prior year
reserve development are discussed in more detail in note 7 of notes to the Company’s consolidated
financial statements.
Claims and claim adjustment expenses in 2012 were $7.86 billion, $590 million or 7% lower than in
2011, primarily reflecting (i) lower catastrophe losses, (ii) lower non-catastrophe weather-related losses
and (iii) an increase in net favorable prior year reserve development, partially offset by (iv) the impact
of loss cost trends. Catastrophe losses in 2012 were $794 million, compared with $1.02 billion in 2011.
Net favorable prior year reserve development in 2012 was $467 million, compared with $245 million in
88