Travelers 2013 Annual Report Download - page 136
Download and view the complete annual report
Please find page 136 of the 2013 Travelers annual report below. You can navigate through the pages in the report by either clicking on the pages listed below, or by using the keyword search tool below to find specific information within the annual report.-
 1
1 -
2
-
3
-
4
-
5
-
6
-
7
-
8
-
9
-
10
-
11
-
12
-
13
-
14
-
15
-
16
-
17
-
18
-
19
-
20
-
21
-
22
-
23
-
24
-
25
-
26
-
27
-
28
-
29
-
30
-
31
-
32
-
33
-
34
-
35
-
36
-
37
-
38
-
39
-
40
-
41
-
42
-
43
-
44
-
45
-
46
-
47
-
48
-
49
-
50
-
51
-
52
-
53
-
54
-
55
-
56
-
57
-
58
-
59
-
60
-
61
-
62
-
63
-
64
-
65
-
66
-
67
-
68
-
69
-
70
-
71
-
72
-
73
-
74
-
75
-
76
-
77
-
78
-
79
-
80
-
81
-
82
-
83
-
84
-
85
-
86
-
87
-
88
-
89
-
90
-
91
-
92
-
93
-
94
-
95
-
96
-
97
-
98
-
99
-
100
-
101
-
102
-
103
-
104
-
105
-
106
-
107
-
108
-
109
-
110
-
111
-
112
-
113
-
114
-
115
-
116
-
117
-
118
-
119
-
120
-
121
-
122
-
123
-
124
-
125
-
 126
126 -
 127
127 -
 128
128 -
 129
129 -
 130
130 -
 131
131 -
 132
132 -
 133
133 -
 134
134 -
 135
135 -
 136
136 -
 137
137 -
 138
138 -
 139
139 -
 140
140 -
 141
141 -
 142
142 -
 143
143 -
 144
144 -
 145
145 -
 146
146 -
147
-
148
-
149
-
150
-
151
-
152
-
153
-
154
-
155
-
156
-
157
-
158
-
159
-
160
-
161
-
162
-
163
-
164
-
165
-
166
-
167
-
168
-
169
-
170
-
171
-
172
-
173
-
174
-
175
-
176
-
177
-
178
-
179
-
180
-
181
-
182
-
183
-
184
-
185
-
186
-
187
-
188
-
189
-
190
-
191
-
192
-
193
-
194
-
195
-
196
-
197
-
198
-
199
-
200
-
201
-
202
-
203
-
204
-
205
-
206
-
207
-
208
-
209
-
210
-
211
-
212
-
213
-
214
-
215
-
216
-
217
-
218
-
219
-
220
-
221
-
222
-
223
-
224
-
225
-
226
-
227
-
228
-
229
-
230
-
231
-
232
-
233
-
234
-
235
-
236
-
237
-
238
-
239
-
240
-
241
-
242
-
243
-
244
-
245
-
246
-
247
-
248
-
249
-
250
-
251
-
252
-
253
-
254
-
255
-
256
-
257
-
258
-
259
-
260
-
261
-
262
-
263
-
264
-
265
-
266
-
267
-
268
-
269
-
270
-
271
-
272
-
273
-
274
-
275
-
276
-
277
-
278
-
279
-
280
-
281
-
282
-
283
-
284
-
285
-
286
-
287
-
288
-
289
-
290
-
291
-
292
-
293
-
294
-
295
-
296
-
297
-
298
-
299
-
300
-
301
-
302
-
303
-
304
 |
 |
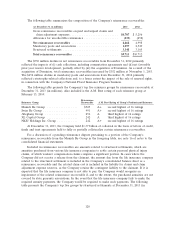
TRV is not dependent on dividends or other forms of repatriation from its foreign operations to
support its liquidity needs. U.S. income taxes have not been recognized on $714 million of the
Company’s foreign operations’ undistributed earnings as of December 31, 2013, as such earnings are
intended to be permanently reinvested in those operations. Furthermore, taxes paid to foreign
governments on these earnings may be used as credits against the U.S. tax on dividend distributions if
such earnings were to be distributed to the holding company. The amount of undistributed earnings
from foreign operations and related taxes on those undistributed earnings were not material to the
Company’s financial position or liquidity at December 31, 2013.
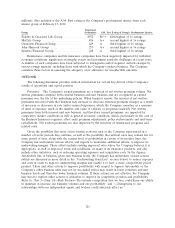
TRV has a shelf registration statement with the Securities and Exchange Commission which
permits it to issue securities from time to time. TRV also has a $1.0 billion line of credit facility with a
syndicate of financial institutions that expires in June 2018. This line of credit also supports TRV’s
$800 million commercial paper program, of which $100 million was outstanding at December 31, 2013.
TRV is not reliant on its commercial paper program to meet its operating cash flow needs.
The Company utilized uncollateralized letters of credit issued by major banks with an aggregate
limit of approximately $206 million, to provide a portion of the capital needed to support its obligations
at Lloyd’s at December 31, 2013. If uncollateralized letters of credit are not available at a reasonable
price or at all in the future, the Company can collateralize these letters of credit or may have to seek
alternative means of supporting its obligations at Lloyd’s, which could include utilizing holding company
funds on hand.
Operating Activities
Net cash flows provided by operating activities were $3.82 billion, $3.23 billion and $2.17 billion in
2013, 2012 and 2011, respectively. Cash flows in 2013 primarily reflected a decrease in losses paid
related to catastrophes and a higher level of collected premiums, partially offset by an increase in
income tax payments. Cash flows in 2012 primarily reflected a decrease in losses paid related to
catastrophes, a lower level of paid losses related to asbestos claims and operations in runoff and a
higher level of collected premiums, partially offset by an increase in paid losses related to
non-catastrophe ongoing business (including the impact of increased loss costs). In 2013, the Company
made no contributions to its qualified domestic pension plan, which was 106% funded at December 31,
2013. In 2012 and 2011, the Company voluntarily made contributions totaling $217 million and
$185 million, respectively, to its qualified domestic pension plan.
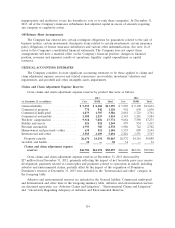
Investing Activities
Net cash flows used in investing activities in 2013 and 2012 were $910 million and $972 million,
compared with net cash flows provided by investing activities of $1.15 billion in 2011. The 2013 total
included $997 million related to the Company’s acquisition of Dominion (net of cash acquired). The
Company’s consolidated total investments at December 31, 2013 decreased by $678 million, or 1% from
year-end 2012, primarily reflecting the impact of a significant decline in net unrealized appreciation of
investments driven by an increase in interest rates, common share repurchases and dividends paid to
shareholders, partially offset by net cash flows provided by operating activities and the impact of the
acquisition of Dominion.
On December 5, 2012, the Company increased its ownership in J. Malucelli Participa¸c˜
oes em
Seguros e Resseguros S.A, its Brazilian joint venture (JMalucelli), through the exercise of a pre-existing
option. As a result, the Company increased its ownership to 49.5% of the venture. JMalucelli is
currently the market leader in surety in Brazil based on market share. The Company’s investment was
funded with cash provided internally from an operating subsidiary of the Company.
The Company’s investment portfolio is managed to support its insurance operations; accordingly,
the portfolio is positioned to meet obligations to policyholders. As such, the primary goals of the
126