Travelers 2013 Annual Report Download - page 200
Download and view the complete annual report
Please find page 200 of the 2013 Travelers annual report below. You can navigate through the pages in the report by either clicking on the pages listed below, or by using the keyword search tool below to find specific information within the annual report.-
 1
1 -
2
-
3
-
4
-
5
-
6
-
7
-
8
-
9
-
10
-
11
-
12
-
13
-
14
-
15
-
16
-
17
-
18
-
19
-
20
-
21
-
22
-
23
-
24
-
25
-
26
-
27
-
28
-
29
-
30
-
31
-
32
-
33
-
34
-
35
-
36
-
37
-
38
-
39
-
40
-
41
-
42
-
43
-
44
-
45
-
46
-
47
-
48
-
49
-
50
-
51
-
52
-
53
-
54
-
55
-
56
-
57
-
58
-
59
-
60
-
61
-
62
-
63
-
64
-
65
-
66
-
67
-
68
-
69
-
70
-
71
-
72
-
73
-
74
-
75
-
76
-
77
-
78
-
79
-
80
-
81
-
82
-
83
-
84
-
85
-
86
-
87
-
88
-
89
-
90
-
91
-
92
-
93
-
94
-
95
-
96
-
97
-
98
-
99
-
100
-
101
-
102
-
103
-
104
-
105
-
106
-
107
-
108
-
109
-
110
-
111
-
112
-
113
-
114
-
115
-
116
-
117
-
118
-
119
-
120
-
121
-
122
-
123
-
124
-
125
-
126
-
127
-
128
-
129
-
130
-
131
-
132
-
133
-
134
-
135
-
136
-
137
-
138
-
139
-
140
-
141
-
142
-
143
-
144
-
145
-
146
-
147
-
148
-
149
-
150
-
151
-
152
-
153
-
154
-
155
-
156
-
157
-
158
-
159
-
160
-
161
-
162
-
163
-
164
-
165
-
166
-
167
-
168
-
169
-
170
-
171
-
172
-
173
-
174
-
175
-
176
-
177
-
178
-
179
-
180
-
181
-
182
-
183
-
184
-
185
-
186
-
187
-
188
-
189
-
 190
190 -
 191
191 -
 192
192 -
 193
193 -
 194
194 -
 195
195 -
 196
196 -
 197
197 -
 198
198 -
 199
199 -
 200
200 -
 201
201 -
 202
202 -
 203
203 -
 204
204 -
 205
205 -
 206
206 -
 207
207 -
 208
208 -
 209
209 -
 210
210 -
211
-
212
-
213
-
214
-
215
-
216
-
217
-
218
-
219
-
220
-
221
-
222
-
223
-
224
-
225
-
226
-
227
-
228
-
229
-
230
-
231
-
232
-
233
-
234
-
235
-
236
-
237
-
238
-
239
-
240
-
241
-
242
-
243
-
244
-
245
-
246
-
247
-
248
-
249
-
250
-
251
-
252
-
253
-
254
-
255
-
256
-
257
-
258
-
259
-
260
-
261
-
262
-
263
-
264
-
265
-
266
-
267
-
268
-
269
-
270
-
271
-
272
-
273
-
274
-
275
-
276
-
277
-
278
-
279
-
280
-
281
-
282
-
283
-
284
-
285
-
286
-
287
-
288
-
289
-
290
-
291
-
292
-
293
-
294
-
295
-
296
-
297
-
298
-
299
-
300
-
301
-
302
-
303
-
304
 |
 |

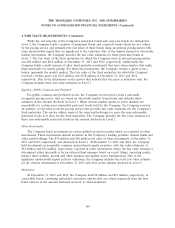
THE TRAVELERS COMPANIES, INC. AND SUBSIDIARIES
NOTES TO CONSOLIDATED FINANCIAL STATEMENTS (Continued)
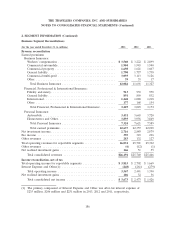
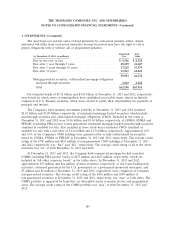
3. INVESTMENTS (Continued)
At December 31, 2013 and 2012, the Company had $131 million and $403 million, respectively, of
securities on loan as part of a tri-party lending agreement.
Proceeds from sales of fixed maturities classified as available for sale were $1.64 billion,
$1.09 billion and $1.16 billion in 2013, 2012 and 2011, respectively. Gross gains of $66 million,
$70 million and $63 million and gross losses of $25 million, $9 million and $10 million were realized on
sales and other fixed maturity-related transactions (excluding impairments) in 2013, 2012 and 2011,
respectively.
At December 31, 2013 and 2012, the Company’s insurance subsidiaries had $4.77 billion and
$4.94 billion, respectively, of securities on deposit at financial institutions in certain states pursuant to
the respective states’ insurance regulatory requirements. Funds deposited with third parties to be used
as collateral to secure various liabilities on behalf of insureds, cedants and other creditors had a fair
value of $59 million and $68 million at December 31, 2013 and 2012, respectively. Other investments
pledged as collateral securing outstanding letters of credit had a fair value of $42 million and
$56 million at December 31, 2013 and 2012, respectively. In addition, the Company utilized a Lloyd’s
trust deposit at December 31, 2013, whereby owned securities with a fair value of approximately
$181 million held by an insurance subsidiary were pledged into a Lloyd’s trust account to support
capital requirements for the Company’s operations at Lloyd’s.
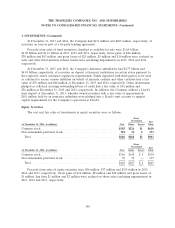
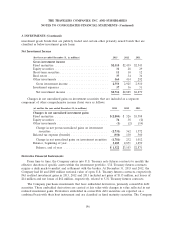
Equity Securities
The cost and fair value of investments in equity securities were as follows:
Gross
Unrealized Fair
(at December 31, 2013, in millions) Cost Gains Losses Value
Common stock ........................................... $385 $226 $1 $610
Non-redeemable preferred stock .............................. 301 34 2 333
Total ................................................. $686 $260 $3 $943
Gross
Unrealized Fair
(at December 31, 2012, in millions) Cost Gains Losses Value
Common stock ........................................... $366 $148 $ 4 $510
Non-redeemable preferred stock .............................. 96 39 — 135
Total ................................................. $462 $187 $ 4 $645
Proceeds from sales of equity securities were $86 million, $37 million and $135 million in 2013,
2012 and 2011, respectively. Gross gains of $16 million, $8 million and $48 million and gross losses of
$1 million, less than $1 million and $2 million were realized on those sales (excluding impairments) in
2013, 2012 and 2011, respectively.
190