Travelers 2013 Annual Report Download - page 130
Download and view the complete annual report
Please find page 130 of the 2013 Travelers annual report below. You can navigate through the pages in the report by either clicking on the pages listed below, or by using the keyword search tool below to find specific information within the annual report.-
 1
1 -
 2
2 -
 3
3 -
 4
4 -
 5
5 -
 6
6 -
 7
7 -
 8
8 -
 9
9 -
 10
10 -
 11
11 -
 12
12 -
 13
13 -
 14
14 -
 15
15 -
 16
16 -
 17
17 -
 18
18 -
 19
19 -
 20
20 -
 21
21 -
 22
22 -
 23
23 -
 24
24 -
 25
25 -
 26
26 -
 27
27 -
 28
28 -
 29
29 -
 30
30 -
 31
31 -
 32
32 -
 33
33 -
 34
34 -
 35
35 -
 36
36 -
 37
37 -
 38
38 -
 39
39 -
 40
40 -
 41
41 -
 42
42 -
 43
43 -
 44
44 -
 45
45 -
 46
46 -
 47
47 -
 48
48 -
 49
49 -
 50
50 -
 51
51 -
 52
52 -
 53
53 -
 54
54 -
 55
55 -
 56
56 -
 57
57 -
 58
58 -
 59
59 -
 60
60 -
 61
61 -
 62
62 -
 63
63 -
 64
64 -
 65
65 -
 66
66 -
 67
67 -
 68
68 -
 69
69 -
 70
70 -
 71
71 -
 72
72 -
 73
73 -
 74
74 -
 75
75 -
 76
76 -
 77
77 -
 78
78 -
 79
79 -
 80
80 -
 81
81 -
 82
82 -
 83
83 -
 84
84 -
 85
85 -
 86
86 -
 87
87 -
 88
88 -
 89
89 -
 90
90 -
 91
91 -
 92
92 -
 93
93 -
 94
94 -
 95
95 -
 96
96 -
 97
97 -
 98
98 -
 99
99 -
 100
100 -
 101
101 -
 102
102 -
 103
103 -
 104
104 -
 105
105 -
 106
106 -
 107
107 -
 108
108 -
 109
109 -
 110
110 -
 111
111 -
 112
112 -
 113
113 -
 114
114 -
 115
115 -
 116
116 -
 117
117 -
 118
118 -
 119
119 -
 120
120 -
 121
121 -
 122
122 -
 123
123 -
 124
124 -
 125
125 -
 126
126 -
 127
127 -
 128
128 -
 129
129 -
 130
130 -
 131
131 -
 132
132 -
 133
133 -
 134
134 -
 135
135 -
 136
136 -
 137
137 -
 138
138 -
 139
139 -
 140
140 -
 141
141 -
 142
142 -
 143
143 -
 144
144 -
 145
145 -
 146
146 -
 147
147 -
 148
148 -
 149
149 -
 150
150 -
 151
151 -
 152
152 -
 153
153 -
 154
154 -
 155
155 -
 156
156 -
 157
157 -
 158
158 -
 159
159 -
 160
160 -
 161
161 -
 162
162 -
 163
163 -
 164
164 -
 165
165 -
 166
166 -
 167
167 -
 168
168 -
 169
169 -
 170
170 -
 171
171 -
 172
172 -
 173
173 -
 174
174 -
 175
175 -
 176
176 -
 177
177 -
 178
178 -
 179
179 -
 180
180 -
 181
181 -
 182
182 -
 183
183 -
 184
184 -
 185
185 -
 186
186 -
 187
187 -
 188
188 -
 189
189 -
 190
190 -
 191
191 -
 192
192 -
 193
193 -
 194
194 -
 195
195 -
 196
196 -
 197
197 -
 198
198 -
 199
199 -
 200
200 -
 201
201 -
 202
202 -
 203
203 -
 204
204 -
 205
205 -
 206
206 -
 207
207 -
 208
208 -
 209
209 -
 210
210 -
 211
211 -
 212
212 -
 213
213 -
 214
214 -
 215
215 -
 216
216 -
 217
217 -
 218
218 -
 219
219 -
 220
220 -
 221
221 -
 222
222 -
 223
223 -
 224
224 -
 225
225 -
 226
226 -
 227
227 -
 228
228 -
 229
229 -
 230
230 -
 231
231 -
 232
232 -
 233
233 -
 234
234 -
 235
235 -
 236
236 -
 237
237 -
 238
238 -
 239
239 -
 240
240 -
 241
241 -
 242
242 -
 243
243 -
 244
244 -
 245
245 -
 246
246 -
 247
247 -
 248
248 -
 249
249 -
 250
250 -
 251
251 -
 252
252 -
 253
253 -
 254
254 -
 255
255 -
 256
256 -
 257
257 -
 258
258 -
 259
259 -
 260
260 -
 261
261 -
 262
262 -
 263
263 -
 264
264 -
 265
265 -
 266
266 -
 267
267 -
 268
268 -
 269
269 -
 270
270 -
 271
271 -
 272
272 -
 273
273 -
 274
274 -
 275
275 -
 276
276 -
 277
277 -
 278
278 -
 279
279 -
 280
280 -
 281
281 -
 282
282 -
 283
283 -
 284
284 -
 285
285 -
 286
286 -
 287
287 -
 288
288 -
 289
289 -
 290
290 -
 291
291 -
 292
292 -
 293
293 -
 294
294 -
 295
295 -
 296
296 -
 297
297 -
 298
298 -
 299
299 -
 300
300 -
 301
301 -
 302
302 -
 303
303 -
 304
304
 |
 |

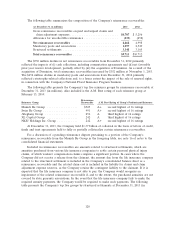
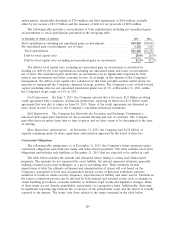
The following table summarizes the composition of the Company’s reinsurance recoverables:
(at December 31, in millions) 2013 2012
Gross reinsurance recoverables on paid and unpaid claims and
claim adjustment expenses ............................ $4,707 $ 5,256
Allowance for uncollectible reinsurance .................... (239) (258)
Net reinsurance recoverables ........................... 4,468 4,998
Mandatory pools and associations ........................ 1,897 2,549
Structured settlements ................................ 3,348 3,165
Total reinsurance recoverables .......................... $9,713 $10,712
The $530 million decline in net reinsurance recoverables from December 31, 2012 primarily
reflected the impacts of (i) cash collections, including commutation agreements and (ii) net favorable
prior year reserve development, partially offset by (iii) the acquisition of Dominion. As a result of the
acquisition of Dominion, total reinsurance recoverables increased by $352 million at November 1, 2013.
The $652 million decline in mandatory pools and associations from December 31, 2012 primarily
reflected catastrophe-related collections and, to a lesser extent the impact of the sale of renewal rights,
in connection with the Company’s National Flood Insurance Program business.
The following table presents the Company’s top five reinsurer groups by reinsurance recoverable at
December 31, 2013 (in millions). Also included is the A.M. Best rating of each reinsurer group at
February 13, 2014:
Reinsurance
Reinsurer Group Recoverable A.M. Best Rating of Group’s Predominant Reinsurer
Munich Re Group .................. $525 A+ second highest of 16 ratings
Swiss Re Group .................... 491 A+ second highest of 16 ratings
Alleghany Group ................... 254 A third highest of 16 ratings
XL Capital Group .................. 242 A third highest of 16 ratings
NKSJ Holdings Inc. Group ............ 242 A+ second highest of 16 ratings
At December 31, 2013, the Company held $1.37 billion of collateral in the form of letters of credit,
funds and trust agreements held to fully or partially collateralize certain reinsurance recoverables.
For a discussion of a pending reinsurance dispute pertaining to a portion of the Company’s
reinsurance recoverable from the Munich Re Group in the foregoing table, see note 16 of notes to the
consolidated financial statements.
Included in reinsurance recoverables are amounts related to structured settlements, which are
annuities purchased from various life insurance companies to settle certain personal physical injury
claims, of which workers’ compensation claims comprise a significant portion. In cases where the
Company did not receive a release from the claimant, the amount due from the life insurance company
related to the structured settlement is included in the Company’s consolidated balance sheet as a
reinsurance recoverable and the related claim cost is included in the liability for claims and claim
adjustment expense reserves, as the Company retains the contingent liability to the claimant. If it is
expected that the life insurance company is not able to pay, the Company would recognize an
impairment of the related reinsurance recoverable if, and to the extent, the purchased annuities are not
covered by state guaranty associations. In the event that the life insurance company fails to make the
required annuity payments, the Company would be required to make such payments. The following
table presents the Company’s top five groups by structured settlements at December 31, 2013 (in
120
