Travelers 2013 Annual Report Download - page 108
Download and view the complete annual report
Please find page 108 of the 2013 Travelers annual report below. You can navigate through the pages in the report by either clicking on the pages listed below, or by using the keyword search tool below to find specific information within the annual report.-
 1
1 -
2
-
3
-
4
-
5
-
6
-
7
-
8
-
9
-
10
-
11
-
12
-
13
-
14
-
15
-
16
-
17
-
18
-
19
-
20
-
21
-
22
-
23
-
24
-
25
-
26
-
27
-
28
-
29
-
30
-
31
-
32
-
33
-
34
-
35
-
36
-
37
-
38
-
39
-
40
-
41
-
42
-
43
-
44
-
45
-
46
-
47
-
48
-
49
-
50
-
51
-
52
-
53
-
54
-
55
-
56
-
57
-
58
-
59
-
60
-
61
-
62
-
63
-
64
-
65
-
66
-
67
-
68
-
69
-
70
-
71
-
72
-
73
-
74
-
75
-
76
-
77
-
78
-
79
-
80
-
81
-
82
-
83
-
84
-
85
-
86
-
87
-
88
-
89
-
90
-
91
-
92
-
93
-
94
-
95
-
96
-
97
-
 98
98 -
 99
99 -
 100
100 -
 101
101 -
 102
102 -
 103
103 -
 104
104 -
 105
105 -
 106
106 -
 107
107 -
 108
108 -
 109
109 -
 110
110 -
 111
111 -
 112
112 -
 113
113 -
 114
114 -
 115
115 -
 116
116 -
 117
117 -
 118
118 -
119
-
120
-
121
-
122
-
123
-
124
-
125
-
126
-
127
-
128
-
129
-
130
-
131
-
132
-
133
-
134
-
135
-
136
-
137
-
138
-
139
-
140
-
141
-
142
-
143
-
144
-
145
-
146
-
147
-
148
-
149
-
150
-
151
-
152
-
153
-
154
-
155
-
156
-
157
-
158
-
159
-
160
-
161
-
162
-
163
-
164
-
165
-
166
-
167
-
168
-
169
-
170
-
171
-
172
-
173
-
174
-
175
-
176
-
177
-
178
-
179
-
180
-
181
-
182
-
183
-
184
-
185
-
186
-
187
-
188
-
189
-
190
-
191
-
192
-
193
-
194
-
195
-
196
-
197
-
198
-
199
-
200
-
201
-
202
-
203
-
204
-
205
-
206
-
207
-
208
-
209
-
210
-
211
-
212
-
213
-
214
-
215
-
216
-
217
-
218
-
219
-
220
-
221
-
222
-
223
-
224
-
225
-
226
-
227
-
228
-
229
-
230
-
231
-
232
-
233
-
234
-
235
-
236
-
237
-
238
-
239
-
240
-
241
-
242
-
243
-
244
-
245
-
246
-
247
-
248
-
249
-
250
-
251
-
252
-
253
-
254
-
255
-
256
-
257
-
258
-
259
-
260
-
261
-
262
-
263
-
264
-
265
-
266
-
267
-
268
-
269
-
270
-
271
-
272
-
273
-
274
-
275
-
276
-
277
-
278
-
279
-
280
-
281
-
282
-
283
-
284
-
285
-
286
-
287
-
288
-
289
-
290
-
291
-
292
-
293
-
294
-
295
-
296
-
297
-
298
-
299
-
300
-
301
-
302
-
303
-
304
 |
 |
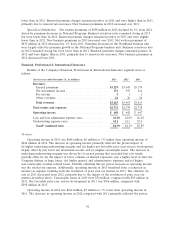
Claims and Expenses
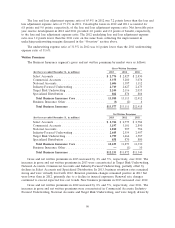
Claims and Claim Adjustment Expenses
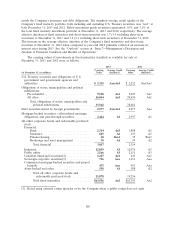
Claims and claim adjustment expenses in 2013 were $4.33 billion, $1.18 billion or 21% lower than
in 2012. The decrease primarily reflected (i) lower catastrophe losses, (ii) lower non-catastrophe
weather-related losses, (iii) the impact of lower volumes of insured exposures and (iv) higher net
favorable prior year reserve development, partially offset by (v) the impact of loss cost trends.
Catastrophe losses in 2013 and 2012 were $250 million and $1.02 billion, respectively. Net favorable
prior year reserve development in 2013 and 2012 was $209 million and $175 million, respectively.
Factors contributing to net favorable prior year reserve development are discussed in more detail in
note 7 of notes to the Company’s consolidated financial statements.
Claims and claim adjustment expenses in 2012 were $5.50 billion, $837 million or 13% lower than
in 2011. The decrease primarily reflected (i) lower catastrophe losses, (ii) lower non-catastrophe
weather-related losses, (iii) lower fire-related losses and (iv) higher net favorable prior year reserve
development, partially offset by (v) the impact of loss cost trends, including a higher number of severe
bodily injury claims in the automobile line of business. Catastrophe losses in 2012 were $1.02 billion,
compared with $1.49 billion in 2011. Net favorable prior year reserve development in 2012 was
$175 million, compared with $110 million in 2011. Factors contributing to net favorable prior year
reserve development are discussed in more detail in note 7 of notes to the Company’s consolidated
financial statements.
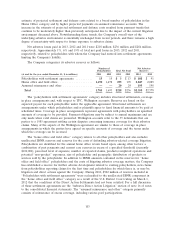
Amortization of Deferred Acquisition Costs
Amortization of deferred acquisition costs in 2013 was $1.29 billion, $152 million or 11% lower
than in 2012. The decrease in 2013 reflected (i) the decline in earned premiums compared with 2012,
(ii) a reclassification of fee income related to the National Flood Insurance Program from general and
administrative expenses to a component of acquisition costs to conform to the presentation prescribed
by insurance regulators, and (iii) lower fixed-value commission expense. Amortization of deferred
acquisition costs in 2012 was $1.44 billion, $21 million or 1% lower than in 2011, primarily due to lower
fixed-value commission expense. The lower fixed-value commission expense in 2013 resulted from an
increase in the number of agents reverting to a contingent commission compensation program (the
costs of which are classified in ‘‘general and administrative expenses’’) from a fixed-value compensation
program (the costs of which are classified in ‘‘amortization of deferred acquisition costs’’).
General and Administrative Expenses
General and administrative expenses in 2013 were $980 million, $80 million or 9% higher than in
2012. The increase in 2013 included an increase in contingent commission expense due to the increase
in the number of agents reverting to a contingent commission compensation program and the impact of
the reclassification of fee income described above. The increase in 2013 also included the impact of
$12 million of restructuring charges, primarily comprised of severance costs related to the Company’s
announced plan to reduce certain claim and other insurance expenses in this segment. These factors
were partially offset by a decline in advertising expense. General and administrative expenses in 2012
were $900 million, $8 million or 1% lower than in 2011.
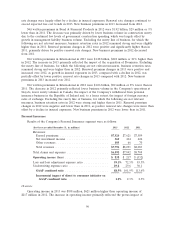
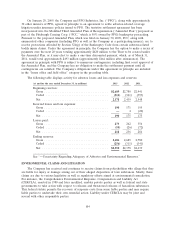
Income Tax Expense
Income tax expense in 2013 was $366 million, $334 million higher than in 2012, primarily reflecting
the impacts of the $953 million increase in underwriting margins (including the impact of a decrease in
catastrophe losses and the increase in net favorable prior year reserve development), partially offset by
lower net investment income and a reduction in income tax expense of $5 million resulting from the
resolution of prior year tax matters in 2013. Income tax expense in 2012 was $32 million, compared to
98