Travelers 2013 Annual Report Download - page 235
Download and view the complete annual report
Please find page 235 of the 2013 Travelers annual report below. You can navigate through the pages in the report by either clicking on the pages listed below, or by using the keyword search tool below to find specific information within the annual report.-
 1
1 -
2
-
3
-
4
-
5
-
6
-
7
-
8
-
9
-
10
-
11
-
12
-
13
-
14
-
15
-
16
-
17
-
18
-
19
-
20
-
21
-
22
-
23
-
24
-
25
-
26
-
27
-
28
-
29
-
30
-
31
-
32
-
33
-
34
-
35
-
36
-
37
-
38
-
39
-
40
-
41
-
42
-
43
-
44
-
45
-
46
-
47
-
48
-
49
-
50
-
51
-
52
-
53
-
54
-
55
-
56
-
57
-
58
-
59
-
60
-
61
-
62
-
63
-
64
-
65
-
66
-
67
-
68
-
69
-
70
-
71
-
72
-
73
-
74
-
75
-
76
-
77
-
78
-
79
-
80
-
81
-
82
-
83
-
84
-
85
-
86
-
87
-
88
-
89
-
90
-
91
-
92
-
93
-
94
-
95
-
96
-
97
-
98
-
99
-
100
-
101
-
102
-
103
-
104
-
105
-
106
-
107
-
108
-
109
-
110
-
111
-
112
-
113
-
114
-
115
-
116
-
117
-
118
-
119
-
120
-
121
-
122
-
123
-
124
-
125
-
126
-
127
-
128
-
129
-
130
-
131
-
132
-
133
-
134
-
135
-
136
-
137
-
138
-
139
-
140
-
141
-
142
-
143
-
144
-
145
-
146
-
147
-
148
-
149
-
150
-
151
-
152
-
153
-
154
-
155
-
156
-
157
-
158
-
159
-
160
-
161
-
162
-
163
-
164
-
165
-
166
-
167
-
168
-
169
-
170
-
171
-
172
-
173
-
174
-
175
-
176
-
177
-
178
-
179
-
180
-
181
-
182
-
183
-
184
-
185
-
186
-
187
-
188
-
189
-
190
-
191
-
192
-
193
-
194
-
195
-
196
-
197
-
198
-
199
-
200
-
201
-
202
-
203
-
204
-
205
-
206
-
207
-
208
-
209
-
210
-
211
-
212
-
213
-
214
-
215
-
216
-
217
-
218
-
219
-
220
-
221
-
222
-
223
-
224
-
 225
225 -
 226
226 -
 227
227 -
 228
228 -
 229
229 -
 230
230 -
 231
231 -
 232
232 -
 233
233 -
 234
234 -
 235
235 -
 236
236 -
 237
237 -
 238
238 -
 239
239 -
 240
240 -
 241
241 -
 242
242 -
 243
243 -
 244
244 -
 245
245 -
246
-
247
-
248
-
249
-
250
-
251
-
252
-
253
-
254
-
255
-
256
-
257
-
258
-
259
-
260
-
261
-
262
-
263
-
264
-
265
-
266
-
267
-
268
-
269
-
270
-
271
-
272
-
273
-
274
-
275
-
276
-
277
-
278
-
279
-
280
-
281
-
282
-
283
-
284
-
285
-
286
-
287
-
288
-
289
-
290
-
291
-
292
-
293
-
294
-
295
-
296
-
297
-
298
-
299
-
300
-
301
-
302
-
303
-
304
 |
 |

THE TRAVELERS COMPANIES, INC. AND SUBSIDIARIES
NOTES TO CONSOLIDATED FINANCIAL STATEMENTS (Continued)
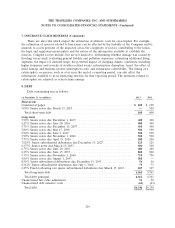
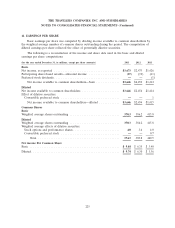
11. EARNINGS PER SHARE
Basic earnings per share was computed by dividing income available to common shareholders by
the weighted average number of common shares outstanding during the period. The computation of
diluted earnings per share reflected the effect of potentially dilutive securities.
The following is a reconciliation of the income and share data used in the basic and diluted
earnings per share computations:
(for the year ended December 31, in millions, except per share amounts) 2013 2012 2011
Basic
Net income, as reported ...................................... $3,673 $2,473 $1,426
Participating share-based awards—allocated income .................. (27) (19) (11)
Preferred stock dividends ...................................... ——(1)
Net income available to common shareholders—basic .............. $3,646 $2,454 $1,414
Diluted
Net income available to common shareholders ...................... $3,646 $2,454 $1,414
Effect of dilutive securities:
Convertible preferred stock .................................. ——1
Net income available to common shareholders—diluted ............ $3,646 $2,454 $1,415
Common Shares
Basic
Weighted average shares outstanding ............................. 370.3 386.2 415.8
Diluted
Weighted average shares outstanding ............................. 370.3 386.2 415.8
Weighted average effects of dilutive securities:
Stock options and performance shares ........................... 4.0 3.6 4.0
Convertible preferred stock .................................. —— 0.7
Total ............................................... 374.3 389.8 420.5
Net income Per Common Share
Basic .................................................... $ 9.84 $ 6.35 $ 3.40
Diluted ................................................... $ 9.74 $ 6.30 $ 3.36
225