Travelers 2013 Annual Report Download - page 90
Download and view the complete annual report
Please find page 90 of the 2013 Travelers annual report below. You can navigate through the pages in the report by either clicking on the pages listed below, or by using the keyword search tool below to find specific information within the annual report.-
 1
1 -
2
-
3
-
4
-
5
-
6
-
7
-
8
-
9
-
10
-
11
-
12
-
13
-
14
-
15
-
16
-
17
-
18
-
19
-
20
-
21
-
22
-
23
-
24
-
25
-
26
-
27
-
28
-
29
-
30
-
31
-
32
-
33
-
34
-
35
-
36
-
37
-
38
-
39
-
40
-
41
-
42
-
43
-
44
-
45
-
46
-
47
-
48
-
49
-
50
-
51
-
52
-
53
-
54
-
55
-
56
-
57
-
58
-
59
-
60
-
61
-
62
-
63
-
64
-
65
-
66
-
67
-
68
-
69
-
70
-
71
-
72
-
73
-
74
-
75
-
76
-
77
-
78
-
79
-
 80
80 -
 81
81 -
 82
82 -
 83
83 -
 84
84 -
 85
85 -
 86
86 -
 87
87 -
 88
88 -
 89
89 -
 90
90 -
 91
91 -
 92
92 -
 93
93 -
 94
94 -
 95
95 -
 96
96 -
 97
97 -
 98
98 -
 99
99 -
 100
100 -
101
-
102
-
103
-
104
-
105
-
106
-
107
-
108
-
109
-
110
-
111
-
112
-
113
-
114
-
115
-
116
-
117
-
118
-
119
-
120
-
121
-
122
-
123
-
124
-
125
-
126
-
127
-
128
-
129
-
130
-
131
-
132
-
133
-
134
-
135
-
136
-
137
-
138
-
139
-
140
-
141
-
142
-
143
-
144
-
145
-
146
-
147
-
148
-
149
-
150
-
151
-
152
-
153
-
154
-
155
-
156
-
157
-
158
-
159
-
160
-
161
-
162
-
163
-
164
-
165
-
166
-
167
-
168
-
169
-
170
-
171
-
172
-
173
-
174
-
175
-
176
-
177
-
178
-
179
-
180
-
181
-
182
-
183
-
184
-
185
-
186
-
187
-
188
-
189
-
190
-
191
-
192
-
193
-
194
-
195
-
196
-
197
-
198
-
199
-
200
-
201
-
202
-
203
-
204
-
205
-
206
-
207
-
208
-
209
-
210
-
211
-
212
-
213
-
214
-
215
-
216
-
217
-
218
-
219
-
220
-
221
-
222
-
223
-
224
-
225
-
226
-
227
-
228
-
229
-
230
-
231
-
232
-
233
-
234
-
235
-
236
-
237
-
238
-
239
-
240
-
241
-
242
-
243
-
244
-
245
-
246
-
247
-
248
-
249
-
250
-
251
-
252
-
253
-
254
-
255
-
256
-
257
-
258
-
259
-
260
-
261
-
262
-
263
-
264
-
265
-
266
-
267
-
268
-
269
-
270
-
271
-
272
-
273
-
274
-
275
-
276
-
277
-
278
-
279
-
280
-
281
-
282
-
283
-
284
-
285
-
286
-
287
-
288
-
289
-
290
-
291
-
292
-
293
-
294
-
295
-
296
-
297
-
298
-
299
-
300
-
301
-
302
-
303
-
304
 |
 |

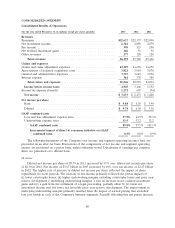
CONSOLIDATED OVERVIEW
Consolidated Results of Operations
(for the year ended December 31, in millions except per share amounts) 2013 2012 2011
Revenues
Premiums .............................................. $22,637 $22,357 $22,090
Net investment income ..................................... 2,716 2,889 2,879
Fee income ............................................. 395 323 296
Net realized investment gains ................................ 166 51 55
Other revenues .......................................... 277 120 126
Total revenues ........................................ 26,191 25,740 25,446
Claims and expenses
Claims and claim adjustment expenses .......................... 13,307 14,676 16,276
Amortization of deferred acquisition costs ....................... 3,821 3,910 3,876
General and administrative expenses ........................... 3,757 3,610 3,556
Interest expense .......................................... 361 378 386
Total claims and expenses ............................... 21,246 22,574 24,094
Income before income taxes ................................ 4,945 3,166 1,352
Income tax expense (benefit) ................................ 1,272 693 (74)
Net income ............................................ $ 3,673 $ 2,473 $ 1,426
Net income per share
Basic ................................................ $ 9.84 $ 6.35 $ 3.40
Diluted .............................................. $ 9.74 $ 6.30 $ 3.36
GAAP combined ratio
Loss and loss adjustment expense ratio ....................... 57.9% 64.9% 72.9%
Underwriting expense ratio ................................ 31.9 32.2 32.2
GAAP combined ratio ................................. 89.8% 97.1% 105.1%
Incremental impact of direct to consumer initiative on GAAP
combined ratio .................................... 0.5% 0.8% 0.9%
The following discussions of the Company’s net income and segment operating income (loss) are
presented on an after-tax basis. Discussions of the components of net income and segment operating
income are presented on a pretax basis, unless otherwise noted. Discussions of earnings per common
share are presented on a diluted basis.
Overview
Diluted net income per share of $9.74 in 2013 increased by 55% over diluted net income per share
of $6.30 in 2012. Net income of $3.67 billion in 2013 increased by 49% over net income of $2.47 billion
in 2012. The higher rate of increase in diluted net income per share reflected the impact of share
repurchases in recent periods. The increase in net income primarily reflected the pretax impacts of
(i) lower catastrophe losses, (ii) higher underwriting margins excluding catastrophe losses and prior year
reserve development (‘‘underlying underwriting margins’’), (iii) an increase in net realized investment
gains and (iv) a gain from the settlement of a legal proceeding, partially offset by (v) lower net
investment income and (vi) lower net favorable prior year reserve development. The improvement in
underlying underwriting margins primarily resulted from the impact of earned pricing that exceeded
loss cost trends in each of the Company’s business segments. Partially offsetting this net pretax increase
80