Travelers 2013 Annual Report Download - page 196
Download and view the complete annual report
Please find page 196 of the 2013 Travelers annual report below. You can navigate through the pages in the report by either clicking on the pages listed below, or by using the keyword search tool below to find specific information within the annual report.-
 1
1 -
2
-
3
-
4
-
5
-
6
-
7
-
8
-
9
-
10
-
11
-
12
-
13
-
14
-
15
-
16
-
17
-
18
-
19
-
20
-
21
-
22
-
23
-
24
-
25
-
26
-
27
-
28
-
29
-
30
-
31
-
32
-
33
-
34
-
35
-
36
-
37
-
38
-
39
-
40
-
41
-
42
-
43
-
44
-
45
-
46
-
47
-
48
-
49
-
50
-
51
-
52
-
53
-
54
-
55
-
56
-
57
-
58
-
59
-
60
-
61
-
62
-
63
-
64
-
65
-
66
-
67
-
68
-
69
-
70
-
71
-
72
-
73
-
74
-
75
-
76
-
77
-
78
-
79
-
80
-
81
-
82
-
83
-
84
-
85
-
86
-
87
-
88
-
89
-
90
-
91
-
92
-
93
-
94
-
95
-
96
-
97
-
98
-
99
-
100
-
101
-
102
-
103
-
104
-
105
-
106
-
107
-
108
-
109
-
110
-
111
-
112
-
113
-
114
-
115
-
116
-
117
-
118
-
119
-
120
-
121
-
122
-
123
-
124
-
125
-
126
-
127
-
128
-
129
-
130
-
131
-
132
-
133
-
134
-
135
-
136
-
137
-
138
-
139
-
140
-
141
-
142
-
143
-
144
-
145
-
146
-
147
-
148
-
149
-
150
-
151
-
152
-
153
-
154
-
155
-
156
-
157
-
158
-
159
-
160
-
161
-
162
-
163
-
164
-
165
-
166
-
167
-
168
-
169
-
170
-
171
-
172
-
173
-
174
-
175
-
176
-
177
-
178
-
179
-
180
-
181
-
182
-
183
-
184
-
185
-
 186
186 -
 187
187 -
 188
188 -
 189
189 -
 190
190 -
 191
191 -
 192
192 -
 193
193 -
 194
194 -
 195
195 -
 196
196 -
 197
197 -
 198
198 -
 199
199 -
 200
200 -
 201
201 -
 202
202 -
 203
203 -
 204
204 -
 205
205 -
 206
206 -
207
-
208
-
209
-
210
-
211
-
212
-
213
-
214
-
215
-
216
-
217
-
218
-
219
-
220
-
221
-
222
-
223
-
224
-
225
-
226
-
227
-
228
-
229
-
230
-
231
-
232
-
233
-
234
-
235
-
236
-
237
-
238
-
239
-
240
-
241
-
242
-
243
-
244
-
245
-
246
-
247
-
248
-
249
-
250
-
251
-
252
-
253
-
254
-
255
-
256
-
257
-
258
-
259
-
260
-
261
-
262
-
263
-
264
-
265
-
266
-
267
-
268
-
269
-
270
-
271
-
272
-
273
-
274
-
275
-
276
-
277
-
278
-
279
-
280
-
281
-
282
-
283
-
284
-
285
-
286
-
287
-
288
-
289
-
290
-
291
-
292
-
293
-
294
-
295
-
296
-
297
-
298
-
299
-
300
-
301
-
302
-
303
-
304
 |
 |

THE TRAVELERS COMPANIES, INC. AND SUBSIDIARIES
NOTES TO CONSOLIDATED FINANCIAL STATEMENTS (Continued)
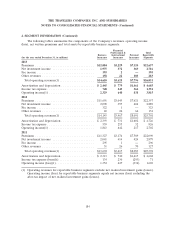
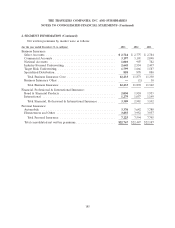
2. SEGMENT INFORMATION (Continued)
Business Segment Reconciliations
(for the year ended December 31, in millions) 2013 2012 2011
Revenue reconciliation
Earned premiums
Business Insurance:
Workers’ compensation ................................. $ 3,560 $ 3,222 $ 2,899
Commercial automobile ................................. 1,904 1,943 1,940
Commercial property ................................... 1,698 1,621 1,607
General liability ....................................... 1,790 1,757 1,738
Commercial multi-peril ................................. 3,093 3,113 3,126
Other .............................................. 39 35 17
Total Business Insurance ............................... 12,084 11,691 11,327
Financial, Professional & International Insurance:
Fidelity and surety ..................................... 913 939 970
General liability ....................................... 891 850 832
International ......................................... 1,248 1,088 1,218
Other .............................................. 177 168 154
Total Financial, Professional & International Insurance ......... 3,229 3,045 3,174
Personal Insurance:
Automobile .......................................... 3,431 3,665 3,720
Homeowners and Other ................................. 3,893 3,956 3,869
Total Personal Insurance ............................... 7,324 7,621 7,589
Total earned premiums ................................ 22,637 22,357 22,090
Net investment income ..................................... 2,716 2,889 2,879
Fee income ............................................. 395 323 296
Other revenues .......................................... 283 132 127
Total operating revenues for reportable segments .................. 26,031 25,701 25,392
Other revenues .......................................... (6) (12) (1)
Net realized investment gains ................................ 166 51 55
Total consolidated revenues .............................. $26,191 $25,740 $25,446
Income reconciliation, net of tax
Total operating income for reportable segments ................... $ 3,815 $ 2,702 $ 1,669
Interest Expense and Other(1) ............................... (248) (261) (279)
Total operating income ................................. 3,567 2,441 1,390
Net realized investment gains ................................ 106 32 36
Total consolidated net income ............................ $ 3,673 $ 2,473 $ 1,426
(1) The primary component of Interest Expense and Other was after-tax interest expense of
$235 million, $246 million and $251 million in 2013, 2012 and 2011, respectively.
186