Travelers 2013 Annual Report Download - page 106
Download and view the complete annual report
Please find page 106 of the 2013 Travelers annual report below. You can navigate through the pages in the report by either clicking on the pages listed below, or by using the keyword search tool below to find specific information within the annual report.-
 1
1 -
2
-
3
-
4
-
5
-
6
-
7
-
8
-
9
-
10
-
11
-
12
-
13
-
14
-
15
-
16
-
17
-
18
-
19
-
20
-
21
-
22
-
23
-
24
-
25
-
26
-
27
-
28
-
29
-
30
-
31
-
32
-
33
-
34
-
35
-
36
-
37
-
38
-
39
-
40
-
41
-
42
-
43
-
44
-
45
-
46
-
47
-
48
-
49
-
50
-
51
-
52
-
53
-
54
-
55
-
56
-
57
-
58
-
59
-
60
-
61
-
62
-
63
-
64
-
65
-
66
-
67
-
68
-
69
-
70
-
71
-
72
-
73
-
74
-
75
-
76
-
77
-
78
-
79
-
80
-
81
-
82
-
83
-
84
-
85
-
86
-
87
-
88
-
89
-
90
-
91
-
92
-
93
-
94
-
95
-
 96
96 -
 97
97 -
 98
98 -
 99
99 -
 100
100 -
 101
101 -
 102
102 -
 103
103 -
 104
104 -
 105
105 -
 106
106 -
 107
107 -
 108
108 -
 109
109 -
 110
110 -
 111
111 -
 112
112 -
 113
113 -
 114
114 -
 115
115 -
 116
116 -
117
-
118
-
119
-
120
-
121
-
122
-
123
-
124
-
125
-
126
-
127
-
128
-
129
-
130
-
131
-
132
-
133
-
134
-
135
-
136
-
137
-
138
-
139
-
140
-
141
-
142
-
143
-
144
-
145
-
146
-
147
-
148
-
149
-
150
-
151
-
152
-
153
-
154
-
155
-
156
-
157
-
158
-
159
-
160
-
161
-
162
-
163
-
164
-
165
-
166
-
167
-
168
-
169
-
170
-
171
-
172
-
173
-
174
-
175
-
176
-
177
-
178
-
179
-
180
-
181
-
182
-
183
-
184
-
185
-
186
-
187
-
188
-
189
-
190
-
191
-
192
-
193
-
194
-
195
-
196
-
197
-
198
-
199
-
200
-
201
-
202
-
203
-
204
-
205
-
206
-
207
-
208
-
209
-
210
-
211
-
212
-
213
-
214
-
215
-
216
-
217
-
218
-
219
-
220
-
221
-
222
-
223
-
224
-
225
-
226
-
227
-
228
-
229
-
230
-
231
-
232
-
233
-
234
-
235
-
236
-
237
-
238
-
239
-
240
-
241
-
242
-
243
-
244
-
245
-
246
-
247
-
248
-
249
-
250
-
251
-
252
-
253
-
254
-
255
-
256
-
257
-
258
-
259
-
260
-
261
-
262
-
263
-
264
-
265
-
266
-
267
-
268
-
269
-
270
-
271
-
272
-
273
-
274
-
275
-
276
-
277
-
278
-
279
-
280
-
281
-
282
-
283
-
284
-
285
-
286
-
287
-
288
-
289
-
290
-
291
-
292
-
293
-
294
-
295
-
296
-
297
-
298
-
299
-
300
-
301
-
302
-
303
-
304
 |
 |

rate changes were largely offset by a decline in insured exposures. Renewal rate changes continued to
exceed expected loss cost trends in 2013. New business premiums in 2013 decreased from 2012.
Net written premiums in Bond & Financial Products in 2012 were $1.92 billion, $29 million or 1%
lower than in 2011. The decrease was primarily driven by lower business volume in construction surety
due to the continued low levels of government construction spending, which was largely offset by
growth in management liability business volume. Excluding the surety line of business, for which the
following are not relevant measures, business retention rates in 2012 remained strong and were slightly
higher than in 2011. Renewal premium changes in 2012 were positive and significantly higher than in
2011, primarily driven by positive renewal rate changes. New business premiums in 2012 decreased
from 2011.
Net written premiums in International in 2013 were $1.28 billion, $222 million or 21% higher than
in 2012. The increase in 2013 primarily reflected the impact of the acquisition of Dominion. Excluding
the surety line of business, for which the following are not relevant measures, business retention rates
remained strong and were higher than in 2012. Renewal premium changes in 2013 were positive and
increased over 2012, as growth in insured exposures in 2013, compared with a decline in 2012, was
partially offset by lower positive renewal rate changes in 2013 compared with 2012. New business
premiums in 2013 increased over 2012.
Net written premiums in International in 2012 were $1.06 billion, $92 million or 8% lower than in
2011. The decrease in 2012 primarily reflected lower business volume in the Company’s operations at
Lloyd’s, lower surety volumes in Canada, the impact of the Company’s withdrawal from personal
insurance business in the Republic of Ireland and, to a lesser extent, the impact of foreign currency
rates of exchange. Excluding the surety line of business, for which the following are not relevant
measures, business retention rates in 2012 were strong and higher than in 2011. Renewal premium
changes in 2012 were negative and lower than in 2011, as positive renewal rate changes were more than
offset by a decline in insured exposures. New business premiums in 2012 were lower than in 2011.
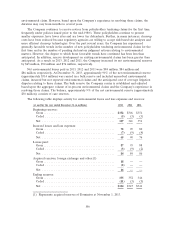
Personal Insurance
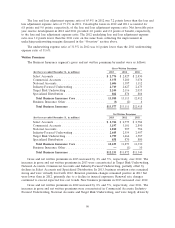
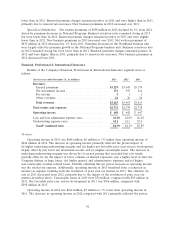
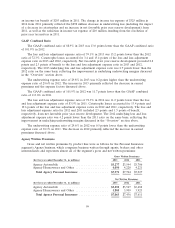
Results of the Company’s Personal Insurance segment were as follows:
(for the year ended December 31, in millions) 2013 2012 2011
Revenues:
Earned premiums ............................ $7,324 $7,621 $7,589
Net investment income ........................ 369 404 424
Other revenues .............................. 103 66 70
Total revenues ............................... $7,796 $8,091 $8,083
Total claims and expenses ........................ $6,592 $7,842 $8,708
Operating income (loss) ......................... $ 838 $ 217 $ (332)
Loss and loss adjustment expense ratio .............. 59.1% 72.3% 83.5%
Underwriting expense ratio ....................... 29.8 29.6 30.1
GAAP combined ratio ......................... 88.9% 101.9% 113.6%
Incremental impact of direct to consumer initiative on
GAAP combined ratio ....................... 1.8% 2.3% 2.5%
Overview
Operating income in 2013 was $838 million, $621 million higher than operating income of
$217 million in 2012. The increase in operating income primarily reflected the pretax impact of
96