Travelers 2013 Annual Report Download - page 252
Download and view the complete annual report
Please find page 252 of the 2013 Travelers annual report below. You can navigate through the pages in the report by either clicking on the pages listed below, or by using the keyword search tool below to find specific information within the annual report.-
 1
1 -
2
-
3
-
4
-
5
-
6
-
7
-
8
-
9
-
10
-
11
-
12
-
13
-
14
-
15
-
16
-
17
-
18
-
19
-
20
-
21
-
22
-
23
-
24
-
25
-
26
-
27
-
28
-
29
-
30
-
31
-
32
-
33
-
34
-
35
-
36
-
37
-
38
-
39
-
40
-
41
-
42
-
43
-
44
-
45
-
46
-
47
-
48
-
49
-
50
-
51
-
52
-
53
-
54
-
55
-
56
-
57
-
58
-
59
-
60
-
61
-
62
-
63
-
64
-
65
-
66
-
67
-
68
-
69
-
70
-
71
-
72
-
73
-
74
-
75
-
76
-
77
-
78
-
79
-
80
-
81
-
82
-
83
-
84
-
85
-
86
-
87
-
88
-
89
-
90
-
91
-
92
-
93
-
94
-
95
-
96
-
97
-
98
-
99
-
100
-
101
-
102
-
103
-
104
-
105
-
106
-
107
-
108
-
109
-
110
-
111
-
112
-
113
-
114
-
115
-
116
-
117
-
118
-
119
-
120
-
121
-
122
-
123
-
124
-
125
-
126
-
127
-
128
-
129
-
130
-
131
-
132
-
133
-
134
-
135
-
136
-
137
-
138
-
139
-
140
-
141
-
142
-
143
-
144
-
145
-
146
-
147
-
148
-
149
-
150
-
151
-
152
-
153
-
154
-
155
-
156
-
157
-
158
-
159
-
160
-
161
-
162
-
163
-
164
-
165
-
166
-
167
-
168
-
169
-
170
-
171
-
172
-
173
-
174
-
175
-
176
-
177
-
178
-
179
-
180
-
181
-
182
-
183
-
184
-
185
-
186
-
187
-
188
-
189
-
190
-
191
-
192
-
193
-
194
-
195
-
196
-
197
-
198
-
199
-
200
-
201
-
202
-
203
-
204
-
205
-
206
-
207
-
208
-
209
-
210
-
211
-
212
-
213
-
214
-
215
-
216
-
217
-
218
-
219
-
220
-
221
-
222
-
223
-
224
-
225
-
226
-
227
-
228
-
229
-
230
-
231
-
232
-
233
-
234
-
235
-
236
-
237
-
238
-
239
-
240
-
241
-
 242
242 -
 243
243 -
 244
244 -
 245
245 -
 246
246 -
 247
247 -
 248
248 -
 249
249 -
 250
250 -
 251
251 -
 252
252 -
 253
253 -
 254
254 -
 255
255 -
 256
256 -
 257
257 -
 258
258 -
 259
259 -
 260
260 -
 261
261 -
 262
262 -
263
-
264
-
265
-
266
-
267
-
268
-
269
-
270
-
271
-
272
-
273
-
274
-
275
-
276
-
277
-
278
-
279
-
280
-
281
-
282
-
283
-
284
-
285
-
286
-
287
-
288
-
289
-
290
-
291
-
292
-
293
-
294
-
295
-
296
-
297
-
298
-
299
-
300
-
301
-
302
-
303
-
304
 |
 |

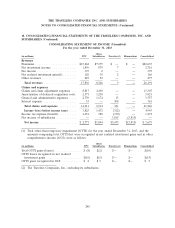
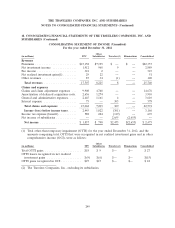
THE TRAVELERS COMPANIES, INC. AND SUBSIDIARIES
NOTES TO CONSOLIDATED FINANCIAL STATEMENTS (Continued)
14. PENSION PLANS, RETIREMENT BENEFITS AND SAVINGS PLANS (Continued)
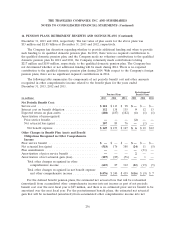
Estimated Future Benefit Payments
The following table presents the estimated benefits expected to be paid by the Company’s pension
and postretirement benefit plans for the next ten years (reflecting estimated future employee service).
Benefits Expected to be Paid
Postretirement
(in millions) Pension Plans Benefit Plans
2014 ...................................... $ 165 $15
2015 ...................................... 176 15
2016 ...................................... 187 15
2017 ...................................... 198 15
2018 ...................................... 209 14
2019 through 2023 ............................ 1,165 70
Savings Plan
The Company has a savings plan, The Travelers 401(k) Savings Plan (the Savings Plan), in which
substantially all U.S. domestic Company employees are eligible to participate. Under the Savings Plan,
the Company matches employee contributions up to 5% of eligible pay, with a maximum annual match
of $6,000 which becomes 100% vested after three years of service. For the year ended December 31,
2011, existing employees whose annual base salary on December 31, 2010 was $175,000 or more, and
employees hired during 2011 at an annual base salary of $175,000 or more, were not eligible for the
Company’s matching contribution. The Company’s matching contribution is made in cash and invested
according to the employee’s current investment elections. The Company’s matching contribution can be
reinvested at any time into any other investment option. The Company’s non-U.S. employees
participate in separate savings plans. The total expense related to all of the savings plans was
$100 million, $92 million and $90 million for the years ended December 31, 2013, 2012 and 2011,
respectively.
Included in the Savings Plan are a legacy Savings Plus Plan (SPP) and a Stock Ownership Plan
(SOP) in which substantially all employees who were hired by legacy SPC before April 1, 2004 were
eligible to participate. In 2004 under the SPP, the Company matched 100% of employees’ contributions
up to a maximum of 6% of their salary. The match was in the form of preferred shares, to the extent
available in the SOP, or in the Company’s common shares. Also allocated to participants were
preferred shares equal to the value of dividends on previously allocated shares. Each share of preferred
stock paid a dividend of $11.72 annually and was convertible into eight shares of the Company’s
common stock. The SOP has no preferred shares available for future allocations. As described in more
detail in note 9 above, all preferred shares outstanding on June 7, 2011 (190,083 shares) were
converted into a total of 1.52 million shares of the Company’s common stock.
All common shares held by the Savings Plan are considered outstanding for diluted EPS
computations and dividends paid on all shares are charged to retained earnings.
15. LEASES
Rent expense was $196 million, $192 million and $191 million in 2013, 2012 and 2011, respectively.
242