Travelers 2013 Annual Report Download - page 95
Download and view the complete annual report
Please find page 95 of the 2013 Travelers annual report below. You can navigate through the pages in the report by either clicking on the pages listed below, or by using the keyword search tool below to find specific information within the annual report.-
 1
1 -
2
-
3
-
4
-
5
-
6
-
7
-
8
-
9
-
10
-
11
-
12
-
13
-
14
-
15
-
16
-
17
-
18
-
19
-
20
-
21
-
22
-
23
-
24
-
25
-
26
-
27
-
28
-
29
-
30
-
31
-
32
-
33
-
34
-
35
-
36
-
37
-
38
-
39
-
40
-
41
-
42
-
43
-
44
-
45
-
46
-
47
-
48
-
49
-
50
-
51
-
52
-
53
-
54
-
55
-
56
-
57
-
58
-
59
-
60
-
61
-
62
-
63
-
64
-
65
-
66
-
67
-
68
-
69
-
70
-
71
-
72
-
73
-
74
-
75
-
76
-
77
-
78
-
79
-
80
-
81
-
82
-
83
-
84
-
 85
85 -
 86
86 -
 87
87 -
 88
88 -
 89
89 -
 90
90 -
 91
91 -
 92
92 -
 93
93 -
 94
94 -
 95
95 -
 96
96 -
 97
97 -
 98
98 -
 99
99 -
 100
100 -
 101
101 -
 102
102 -
 103
103 -
 104
104 -
 105
105 -
106
-
107
-
108
-
109
-
110
-
111
-
112
-
113
-
114
-
115
-
116
-
117
-
118
-
119
-
120
-
121
-
122
-
123
-
124
-
125
-
126
-
127
-
128
-
129
-
130
-
131
-
132
-
133
-
134
-
135
-
136
-
137
-
138
-
139
-
140
-
141
-
142
-
143
-
144
-
145
-
146
-
147
-
148
-
149
-
150
-
151
-
152
-
153
-
154
-
155
-
156
-
157
-
158
-
159
-
160
-
161
-
162
-
163
-
164
-
165
-
166
-
167
-
168
-
169
-
170
-
171
-
172
-
173
-
174
-
175
-
176
-
177
-
178
-
179
-
180
-
181
-
182
-
183
-
184
-
185
-
186
-
187
-
188
-
189
-
190
-
191
-
192
-
193
-
194
-
195
-
196
-
197
-
198
-
199
-
200
-
201
-
202
-
203
-
204
-
205
-
206
-
207
-
208
-
209
-
210
-
211
-
212
-
213
-
214
-
215
-
216
-
217
-
218
-
219
-
220
-
221
-
222
-
223
-
224
-
225
-
226
-
227
-
228
-
229
-
230
-
231
-
232
-
233
-
234
-
235
-
236
-
237
-
238
-
239
-
240
-
241
-
242
-
243
-
244
-
245
-
246
-
247
-
248
-
249
-
250
-
251
-
252
-
253
-
254
-
255
-
256
-
257
-
258
-
259
-
260
-
261
-
262
-
263
-
264
-
265
-
266
-
267
-
268
-
269
-
270
-
271
-
272
-
273
-
274
-
275
-
276
-
277
-
278
-
279
-
280
-
281
-
282
-
283
-
284
-
285
-
286
-
287
-
288
-
289
-
290
-
291
-
292
-
293
-
294
-
295
-
296
-
297
-
298
-
299
-
300
-
301
-
302
-
303
-
304
 |
 |
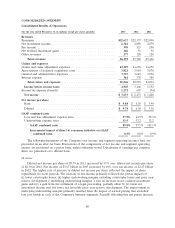
Amortization of Deferred Acquisition Costs
Amortization of deferred acquisition costs in 2013 was $3.82 billion, $89 million or 2% lower than
in 2012. Amortization of deferred acquisition costs in 2012 was $3.91 billion, $34 million or 1% higher
than in 2011. Amortization of deferred acquisition costs is discussed in more detail in the segment
discussions that follow.
General and Administrative Expenses
General and administrative expenses in 2013 were $3.76 billion, $147 million or 4% higher than in
2012. General and administrative expenses in 2012 were $3.61 billion, $54 million or 2% higher than in
2011. General and administrative expenses are discussed in more detail in the segment discussions that
follow.
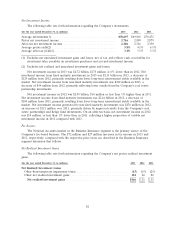
Interest Expense
Interest expense in 2013, 2012 and 2011 was $361 million, $378 million and $386 million,
respectively. The declines both in 2013 and 2012 compared with the respective prior years primarily
reflected lower average levels of debt outstanding.
Income Tax Expense (Benefit)
Income tax expense in 2013 was $1.27 billion, $579 million or 84% higher than in 2012, primarily
reflecting the impact of a $1.66 billion increase in underwriting margins (including the impacts of
decreases in catastrophe losses and net favorable prior year reserve development), partially offset by
the impact of lower net investment income and a reduction in income tax expense of $63 million
resulting from the resolution of prior year tax matters. Income tax expense in 2012 was $693 million,
compared to an income tax benefit of $74 million in 2011. The increase in income tax expense of
$767 million in 2012 from 2011 primarily reflected the $1.77 billion increase in underwriting margins in
2012 (including the impacts of a decrease in catastrophe losses and an increase in net favorable prior
year reserve development) over 2011 and the $121 million increase in net investment income from
non-fixed maturity investments over 2011, as well as the reduction in income tax expense of
$104 million in 2011 resulting from the resolution of prior year tax matters.
The Company’s effective tax rate was 26%, 22% and (5)% in 2013, 2012 and 2011, respectively.
The effective tax rates in all years were lower than the statutory rate of 35% primarily due to the
impact of tax-exempt investment income on the calculation of the Company’s income tax provision. The
effective tax rate of (5%) in 2011 also reflected the impact of the significant underwriting loss that
primarily resulted from catastrophe losses. In addition, the effective tax rates for 2013 and 2011 were
reduced by the impact of the resolution of prior year tax matters.
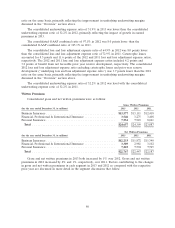
GAAP Combined Ratios
The consolidated GAAP combined ratio of 89.8% in 2013 was 7.3 points lower than the
consolidated GAAP combined ratio of 97.1% in 2012.
The consolidated loss and loss adjustment expense ratio of 57.9% in 2013 was 7.0 points lower
than the consolidated loss and loss adjustment expense ratio of 64.9% in 2012. Catastrophe losses
accounted for 2.6 points and 8.3 points of the 2013 and 2012 loss and loss adjustment expense ratios,
respectively. The 2013 and 2012 loss and loss adjustment expense ratios included 3.7 points and
4.2 points of benefit from net favorable prior year reserve development, respectively. The consolidated
2013 loss and loss adjustment expense ratio excluding catastrophe losses and prior year reserve
development (‘‘underlying loss and loss adjustment expense ratio’’) was 1.8 points lower than the 2012
85