Travelers 2013 Annual Report Download - page 86
Download and view the complete annual report
Please find page 86 of the 2013 Travelers annual report below. You can navigate through the pages in the report by either clicking on the pages listed below, or by using the keyword search tool below to find specific information within the annual report.-
 1
1 -
2
-
3
-
4
-
5
-
6
-
7
-
8
-
9
-
10
-
11
-
12
-
13
-
14
-
15
-
16
-
17
-
18
-
19
-
20
-
21
-
22
-
23
-
24
-
25
-
26
-
27
-
28
-
29
-
30
-
31
-
32
-
33
-
34
-
35
-
36
-
37
-
38
-
39
-
40
-
41
-
42
-
43
-
44
-
45
-
46
-
47
-
48
-
49
-
50
-
51
-
52
-
53
-
54
-
55
-
56
-
57
-
58
-
59
-
60
-
61
-
62
-
63
-
64
-
65
-
66
-
67
-
68
-
69
-
70
-
71
-
72
-
73
-
74
-
75
-
 76
76 -
 77
77 -
 78
78 -
 79
79 -
 80
80 -
 81
81 -
 82
82 -
 83
83 -
 84
84 -
 85
85 -
 86
86 -
 87
87 -
 88
88 -
 89
89 -
 90
90 -
 91
91 -
 92
92 -
 93
93 -
 94
94 -
 95
95 -
 96
96 -
97
-
98
-
99
-
100
-
101
-
102
-
103
-
104
-
105
-
106
-
107
-
108
-
109
-
110
-
111
-
112
-
113
-
114
-
115
-
116
-
117
-
118
-
119
-
120
-
121
-
122
-
123
-
124
-
125
-
126
-
127
-
128
-
129
-
130
-
131
-
132
-
133
-
134
-
135
-
136
-
137
-
138
-
139
-
140
-
141
-
142
-
143
-
144
-
145
-
146
-
147
-
148
-
149
-
150
-
151
-
152
-
153
-
154
-
155
-
156
-
157
-
158
-
159
-
160
-
161
-
162
-
163
-
164
-
165
-
166
-
167
-
168
-
169
-
170
-
171
-
172
-
173
-
174
-
175
-
176
-
177
-
178
-
179
-
180
-
181
-
182
-
183
-
184
-
185
-
186
-
187
-
188
-
189
-
190
-
191
-
192
-
193
-
194
-
195
-
196
-
197
-
198
-
199
-
200
-
201
-
202
-
203
-
204
-
205
-
206
-
207
-
208
-
209
-
210
-
211
-
212
-
213
-
214
-
215
-
216
-
217
-
218
-
219
-
220
-
221
-
222
-
223
-
224
-
225
-
226
-
227
-
228
-
229
-
230
-
231
-
232
-
233
-
234
-
235
-
236
-
237
-
238
-
239
-
240
-
241
-
242
-
243
-
244
-
245
-
246
-
247
-
248
-
249
-
250
-
251
-
252
-
253
-
254
-
255
-
256
-
257
-
258
-
259
-
260
-
261
-
262
-
263
-
264
-
265
-
266
-
267
-
268
-
269
-
270
-
271
-
272
-
273
-
274
-
275
-
276
-
277
-
278
-
279
-
280
-
281
-
282
-
283
-
284
-
285
-
286
-
287
-
288
-
289
-
290
-
291
-
292
-
293
-
294
-
295
-
296
-
297
-
298
-
299
-
300
-
301
-
302
-
303
-
304
 |
 |

6FEB201419574093
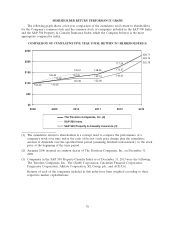
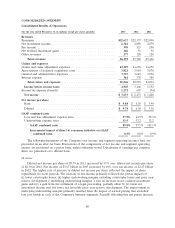
SHAREHOLDER RETURN PERFORMANCE GRAPH
The following graph shows a five-year comparison of the cumulative total return to shareholders
for the Company’s common stock and the common stock of companies included in the S&P 500 Index
and the S&P 500 Property & Casualty Insurance Index, which the Company believes is the most
appropriate comparative index.
COMPARISON OF CUMULATIVE FIVE YEAR TOTAL RETURN TO SHAREHOLDERS(1)
$0
$50
$100
$150
$250
$200
2008 2009 2010 201320122011
228.71
177.28
148.59
112.35
145.51
228.19
172.37
142.14
130.09
126.46
202.78
100.00
113.36
122.38 122.08
146.63
The Travelers Companies, Inc. (2)
S&P 500 Index
S&P 500 Property & Casualty Insurance (3)
(1) The cumulative return to shareholders is a concept used to compare the performance of a
company’s stock over time and is the ratio of the net stock price change plus the cumulative
amount of dividends over the specified time period (assuming dividend reinvestment), to the stock
price at the beginning of the time period.
(2) Assumes $100 invested in common shares of The Travelers Companies, Inc. on December 31,
2008.
(3) Companies in the S&P 500 Property-Casualty Index as of December 31, 2013 were the following:
The Travelers Companies, Inc., The Chubb Corporation, Cincinnati Financial Corporation,
Progressive Corporation, Allstate Corporation, XL Group, plc., and ACE Ltd.
Returns of each of the companies included in this index have been weighted according to their
respective market capitalizations.
76