Travelers 2013 Annual Report Download - page 91
Download and view the complete annual report
Please find page 91 of the 2013 Travelers annual report below. You can navigate through the pages in the report by either clicking on the pages listed below, or by using the keyword search tool below to find specific information within the annual report.-
 1
1 -
2
-
3
-
4
-
5
-
6
-
7
-
8
-
9
-
10
-
11
-
12
-
13
-
14
-
15
-
16
-
17
-
18
-
19
-
20
-
21
-
22
-
23
-
24
-
25
-
26
-
27
-
28
-
29
-
30
-
31
-
32
-
33
-
34
-
35
-
36
-
37
-
38
-
39
-
40
-
41
-
42
-
43
-
44
-
45
-
46
-
47
-
48
-
49
-
50
-
51
-
52
-
53
-
54
-
55
-
56
-
57
-
58
-
59
-
60
-
61
-
62
-
63
-
64
-
65
-
66
-
67
-
68
-
69
-
70
-
71
-
72
-
73
-
74
-
75
-
76
-
77
-
78
-
79
-
80
-
 81
81 -
 82
82 -
 83
83 -
 84
84 -
 85
85 -
 86
86 -
 87
87 -
 88
88 -
 89
89 -
 90
90 -
 91
91 -
 92
92 -
 93
93 -
 94
94 -
 95
95 -
 96
96 -
 97
97 -
 98
98 -
 99
99 -
 100
100 -
 101
101 -
102
-
103
-
104
-
105
-
106
-
107
-
108
-
109
-
110
-
111
-
112
-
113
-
114
-
115
-
116
-
117
-
118
-
119
-
120
-
121
-
122
-
123
-
124
-
125
-
126
-
127
-
128
-
129
-
130
-
131
-
132
-
133
-
134
-
135
-
136
-
137
-
138
-
139
-
140
-
141
-
142
-
143
-
144
-
145
-
146
-
147
-
148
-
149
-
150
-
151
-
152
-
153
-
154
-
155
-
156
-
157
-
158
-
159
-
160
-
161
-
162
-
163
-
164
-
165
-
166
-
167
-
168
-
169
-
170
-
171
-
172
-
173
-
174
-
175
-
176
-
177
-
178
-
179
-
180
-
181
-
182
-
183
-
184
-
185
-
186
-
187
-
188
-
189
-
190
-
191
-
192
-
193
-
194
-
195
-
196
-
197
-
198
-
199
-
200
-
201
-
202
-
203
-
204
-
205
-
206
-
207
-
208
-
209
-
210
-
211
-
212
-
213
-
214
-
215
-
216
-
217
-
218
-
219
-
220
-
221
-
222
-
223
-
224
-
225
-
226
-
227
-
228
-
229
-
230
-
231
-
232
-
233
-
234
-
235
-
236
-
237
-
238
-
239
-
240
-
241
-
242
-
243
-
244
-
245
-
246
-
247
-
248
-
249
-
250
-
251
-
252
-
253
-
254
-
255
-
256
-
257
-
258
-
259
-
260
-
261
-
262
-
263
-
264
-
265
-
266
-
267
-
268
-
269
-
270
-
271
-
272
-
273
-
274
-
275
-
276
-
277
-
278
-
279
-
280
-
281
-
282
-
283
-
284
-
285
-
286
-
287
-
288
-
289
-
290
-
291
-
292
-
293
-
294
-
295
-
296
-
297
-
298
-
299
-
300
-
301
-
302
-
303
-
304
 |
 |
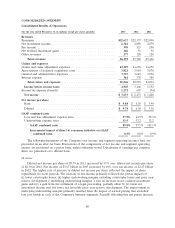
in income was the related tax expense. Additionally, net income in 2013 benefited from a reduction in
income tax expense resulting from the resolution of prior year tax matters. The effective tax rate in
2013 was higher than in 2012. This resulted from interest on municipal bonds, which is effectively taxed
at a rate that is lower than the corporate tax rate of 35%, comprising a lower percentage of pretax
income, partially offset by the resolution of prior year tax matters discussed above. Catastrophe losses
in 2013 were $591 million, compared with $1.86 billion in 2012. Net favorable prior year reserve
development in 2013 was $840 million, compared with $940 million in 2012.
Diluted net income per share of $6.30 in 2012 increased by 88% over diluted net income per share
of $3.36 in 2011. Net income of $2.47 billion in 2012 increased by 73% over net income of $1.43 billion
in 2011. The higher rate of increase in diluted net income per share reflected the impact of share
repurchases in recent periods. The increase in net income primarily reflected the pretax impact of
(i) higher underlying underwriting margins, (ii) a decline in catastrophe losses and (iii) higher net
favorable prior year reserve development. The improvement in underlying underwriting margins
primarily resulted from lower non-catastrophe weather-related losses in the Business Insurance and
Personal Insurance segments and the impact of earned pricing that exceeded loss cost trends in the
Business Insurance and Financial, Professional & International Insurance segments. Partially offsetting
this pretax increase was the related tax expense. Additionally, net income in 2011 benefited from a
reduction in income tax expense resulting from the resolution of various prior year tax matters. The
effective tax rate in 2012 was higher than in 2011. This resulted from interest on municipal bonds,
which is effectively taxed at a rate that is lower than the corporate tax rate of 35%, comprising a lower
percentage of pretax income, and the resolution of prior year tax matters in 2011 discussed above.
Catastrophe losses in 2012 were $1.86 billion, compared with $2.56 billion in 2011. Net favorable prior
year reserve development in 2012 was $940 million, compared with $715 million in 2011.
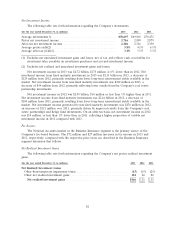
Revenues
Earned Premiums
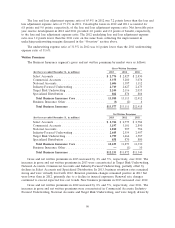
Earned premiums in 2013 were $22.64 billion, $280 million or 1% higher than in 2012. In the
Business Insurance segment, earned premiums in 2013 increased by 3% over 2012. In the Financial,
Professional & International Insurance segment, earned premiums in 2013 increased by 6% over 2012.
In the Personal Insurance segment, earned premiums in 2013 decreased by 4% from 2012.
Earned premiums in 2012 were $22.36 billion, $267 million or 1% higher than in 2011. In the
Business Insurance segment, earned premiums in 2012 increased by 3% over 2011. In the Financial,
Professional & International Insurance segment, earned premiums in 2012 decreased by 4% from 2011.
In the Personal Insurance segment, earned premiums in 2012 increased by less than 1% over 2011.
Factors contributing to the changes in earned premiums in each segment in 2013 and 2012
compared with the respective prior year are discussed in more detail in the segment discussions that
follow.
81