Travelers 2013 Annual Report Download - page 206
Download and view the complete annual report
Please find page 206 of the 2013 Travelers annual report below. You can navigate through the pages in the report by either clicking on the pages listed below, or by using the keyword search tool below to find specific information within the annual report.-
 1
1 -
2
-
3
-
4
-
5
-
6
-
7
-
8
-
9
-
10
-
11
-
12
-
13
-
14
-
15
-
16
-
17
-
18
-
19
-
20
-
21
-
22
-
23
-
24
-
25
-
26
-
27
-
28
-
29
-
30
-
31
-
32
-
33
-
34
-
35
-
36
-
37
-
38
-
39
-
40
-
41
-
42
-
43
-
44
-
45
-
46
-
47
-
48
-
49
-
50
-
51
-
52
-
53
-
54
-
55
-
56
-
57
-
58
-
59
-
60
-
61
-
62
-
63
-
64
-
65
-
66
-
67
-
68
-
69
-
70
-
71
-
72
-
73
-
74
-
75
-
76
-
77
-
78
-
79
-
80
-
81
-
82
-
83
-
84
-
85
-
86
-
87
-
88
-
89
-
90
-
91
-
92
-
93
-
94
-
95
-
96
-
97
-
98
-
99
-
100
-
101
-
102
-
103
-
104
-
105
-
106
-
107
-
108
-
109
-
110
-
111
-
112
-
113
-
114
-
115
-
116
-
117
-
118
-
119
-
120
-
121
-
122
-
123
-
124
-
125
-
126
-
127
-
128
-
129
-
130
-
131
-
132
-
133
-
134
-
135
-
136
-
137
-
138
-
139
-
140
-
141
-
142
-
143
-
144
-
145
-
146
-
147
-
148
-
149
-
150
-
151
-
152
-
153
-
154
-
155
-
156
-
157
-
158
-
159
-
160
-
161
-
162
-
163
-
164
-
165
-
166
-
167
-
168
-
169
-
170
-
171
-
172
-
173
-
174
-
175
-
176
-
177
-
178
-
179
-
180
-
181
-
182
-
183
-
184
-
185
-
186
-
187
-
188
-
189
-
190
-
191
-
192
-
193
-
194
-
195
-
 196
196 -
 197
197 -
 198
198 -
 199
199 -
 200
200 -
 201
201 -
 202
202 -
 203
203 -
 204
204 -
 205
205 -
 206
206 -
 207
207 -
 208
208 -
 209
209 -
 210
210 -
 211
211 -
 212
212 -
 213
213 -
 214
214 -
 215
215 -
 216
216 -
217
-
218
-
219
-
220
-
221
-
222
-
223
-
224
-
225
-
226
-
227
-
228
-
229
-
230
-
231
-
232
-
233
-
234
-
235
-
236
-
237
-
238
-
239
-
240
-
241
-
242
-
243
-
244
-
245
-
246
-
247
-
248
-
249
-
250
-
251
-
252
-
253
-
254
-
255
-
256
-
257
-
258
-
259
-
260
-
261
-
262
-
263
-
264
-
265
-
266
-
267
-
268
-
269
-
270
-
271
-
272
-
273
-
274
-
275
-
276
-
277
-
278
-
279
-
280
-
281
-
282
-
283
-
284
-
285
-
286
-
287
-
288
-
289
-
290
-
291
-
292
-
293
-
294
-
295
-
296
-
297
-
298
-
299
-
300
-
301
-
302
-
303
-
304
 |
 |

THE TRAVELERS COMPANIES, INC. AND SUBSIDIARIES
NOTES TO CONSOLIDATED FINANCIAL STATEMENTS (Continued)
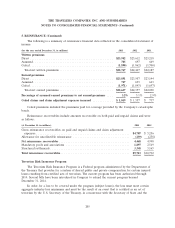
3. INVESTMENTS (Continued)
investment grade bonds that are publicly traded and certain other privately issued bonds that are
classified as below investment grade loans.
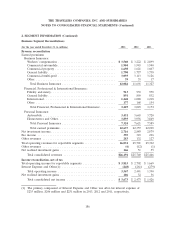
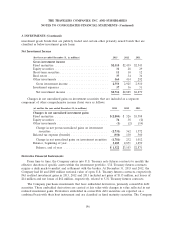
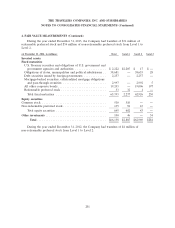
Net Investment Income
(for the year ended December 31, in millions) 2013 2012 2011
Gross investment income
Fixed maturities ............................... $2,310 $2,439 $2,543
Equity securities ............................... 31 28 29
Short-term securities ............................ 11 10 12
Real estate ................................... 37 34 34
Other investments ............................. 364 414 292
Gross investment income ....................... 2,753 2,925 2,910
Investment expenses ............................ 37 36 31
Net investment income ........................ $2,716 $2,889 $2,879
Changes in net unrealized gains on investment securities that are included as a separate
component of other comprehensive income (loss) were as follows:
(at and for the year ended December 31, in millions) 2013 2012 2011
Changes in net unrealized investment gains
Fixed maturities .............................. $(2,804) $ 326 $1,588
Equity securities .............................. 74 38 (2)
Other investments ............................. (1) (2) (14)
Change in net pretax unrealized gains on investment
securities ................................ (2,731) 362 1,572
Related tax expense (benefit) ..................... (950) 130 560
Change in net unrealized gains on investment securities (1,781) 232 1,012
Balance, beginning of year ....................... 3,103 2,871 1,859
Balance, end of year ......................... $ 1,322 $3,103 $2,871
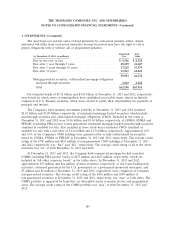
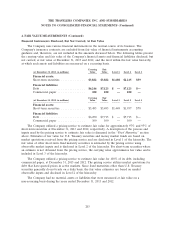
Derivative Financial Instruments
From time to time, the Company enters into U.S. Treasury note futures contracts to modify the
effective duration of specific assets within the investment portfolio. U.S. Treasury futures contracts
require a daily mark-to-market and settlement with the broker. At December 31, 2013 and 2012, the
Company had $0 and $800 million notional value of open U.S. Treasury futures contracts, respectively.
Net realized investment gains in 2013, 2012 and 2011 included net gains of $115 million, net losses of
$14 million and net losses of $62 million, respectively, related to U.S. Treasury futures contracts.
The Company purchases investments that have embedded derivatives, primarily convertible debt
securities. These embedded derivatives are carried at fair value with changes in value reflected in net
realized investment gains. Derivatives embedded in convertible debt securities are reported on a
combined basis with their host instrument and are classified as fixed maturity securities. The Company
196