Travelers 2013 Annual Report Download - page 101
Download and view the complete annual report
Please find page 101 of the 2013 Travelers annual report below. You can navigate through the pages in the report by either clicking on the pages listed below, or by using the keyword search tool below to find specific information within the annual report.-
 1
1 -
2
-
3
-
4
-
5
-
6
-
7
-
8
-
9
-
10
-
11
-
12
-
13
-
14
-
15
-
16
-
17
-
18
-
19
-
20
-
21
-
22
-
23
-
24
-
25
-
26
-
27
-
28
-
29
-
30
-
31
-
32
-
33
-
34
-
35
-
36
-
37
-
38
-
39
-
40
-
41
-
42
-
43
-
44
-
45
-
46
-
47
-
48
-
49
-
50
-
51
-
52
-
53
-
54
-
55
-
56
-
57
-
58
-
59
-
60
-
61
-
62
-
63
-
64
-
65
-
66
-
67
-
68
-
69
-
70
-
71
-
72
-
73
-
74
-
75
-
76
-
77
-
78
-
79
-
80
-
81
-
82
-
83
-
84
-
85
-
86
-
87
-
88
-
89
-
90
-
 91
91 -
 92
92 -
 93
93 -
 94
94 -
 95
95 -
 96
96 -
 97
97 -
 98
98 -
 99
99 -
 100
100 -
 101
101 -
 102
102 -
 103
103 -
 104
104 -
 105
105 -
 106
106 -
 107
107 -
 108
108 -
 109
109 -
 110
110 -
 111
111 -
112
-
113
-
114
-
115
-
116
-
117
-
118
-
119
-
120
-
121
-
122
-
123
-
124
-
125
-
126
-
127
-
128
-
129
-
130
-
131
-
132
-
133
-
134
-
135
-
136
-
137
-
138
-
139
-
140
-
141
-
142
-
143
-
144
-
145
-
146
-
147
-
148
-
149
-
150
-
151
-
152
-
153
-
154
-
155
-
156
-
157
-
158
-
159
-
160
-
161
-
162
-
163
-
164
-
165
-
166
-
167
-
168
-
169
-
170
-
171
-
172
-
173
-
174
-
175
-
176
-
177
-
178
-
179
-
180
-
181
-
182
-
183
-
184
-
185
-
186
-
187
-
188
-
189
-
190
-
191
-
192
-
193
-
194
-
195
-
196
-
197
-
198
-
199
-
200
-
201
-
202
-
203
-
204
-
205
-
206
-
207
-
208
-
209
-
210
-
211
-
212
-
213
-
214
-
215
-
216
-
217
-
218
-
219
-
220
-
221
-
222
-
223
-
224
-
225
-
226
-
227
-
228
-
229
-
230
-
231
-
232
-
233
-
234
-
235
-
236
-
237
-
238
-
239
-
240
-
241
-
242
-
243
-
244
-
245
-
246
-
247
-
248
-
249
-
250
-
251
-
252
-
253
-
254
-
255
-
256
-
257
-
258
-
259
-
260
-
261
-
262
-
263
-
264
-
265
-
266
-
267
-
268
-
269
-
270
-
271
-
272
-
273
-
274
-
275
-
276
-
277
-
278
-
279
-
280
-
281
-
282
-
283
-
284
-
285
-
286
-
287
-
288
-
289
-
290
-
291
-
292
-
293
-
294
-
295
-
296
-
297
-
298
-
299
-
300
-
301
-
302
-
303
-
304
 |
 |
rate increases and positive audit premium adjustments (which were higher than in 2011). In 2012,
business retention rates remained strong but were lower than in 2011. Renewal premium changes
remained positive in 2012 and were higher than in 2011. New business premiums in 2012 decreased
from 2011.
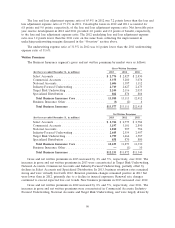
Select Accounts. Net written premiums of $2.72 billion in 2013 decreased by 2% from 2012.
Business retention rates in 2013 remained strong and were level with 2012. Renewal premium changes
remained positive in 2013 and were slightly higher than in 2012, primarily due to higher renewal rate
increases. New business premiums in 2013 declined from 2012. Net written premiums of $2.78 billion in
2012 were virtually level with 2011. Business retention rates in 2012 remained strong but were lower
than in 2011. Renewal premium changes remained positive in 2012 and were higher than in 2011,
primarily due to higher renewal rate increases. New business premiums in 2012 decreased from 2011.
Net written premiums in both 2013 and 2012 were favorably impacted by positive audit premium
adjustments.
Commercial Accounts. Net written premiums of $3.20 billion in 2013 increased by 3% over 2012.
Business retention rates in 2013 remained strong but were lower than in 2012. Renewal premium
changes remained positive in 2013 but were lower than in 2012, due to a decline in both insured
exposures and renewal price changes. New business premiums in 2013 increased over 2012. Net written
premiums of $3.10 billion in 2012 increased by 7% over 2011. Business retention rates remained strong
but were lower than in 2011. Renewal premium changes remained positive in 2012 and were higher
than in 2011, primarily due to renewal rate increases. New business premiums in 2012 decreased from
2011. Net written premiums in 2012 were favorably impacted by positive audit premium adjustments
(which were higher than in 2011).
National Accounts. Net written premiums of $1.01 billion in 2013 increased by 11% over 2012,
primarily due to continuing strong retention, positive renewal premium changes, increased new business
and growth in workers’ compensation residual market pools. Business retention rates remained strong
in 2013 but were lower than in 2012. Renewal premium changes in 2013 remained positive but were
lower than in 2012, driven by a decline in payroll exposure growth. New business premiums in 2013
were higher than in 2012. Net written premiums of $907 million in 2012 increased by 16% over 2011.
Business retention rates remained strong in 2012 and were level with 2011. Renewal premium changes
were positive and were higher than in 2011, driven by payroll exposure growth. New business premiums
in 2012 increased over 2011. Growth in workers’ compensation residual market pools also contributed
to premium growth in both 2013 and 2012.
Industry-Focused Underwriting. Net written premiums of $2.65 billion in 2013 increased by 4%
over 2012, as premium growth in the Construction and Technology business units was partially offset by
a decline in the Public Sector Services business unit. Business retention rates remained strong in 2013
and were higher than in 2012. Renewal premium changes remained positive in 2013 but were lower
than in 2012. New business premiums in 2013 increased over 2012. Net written premiums of
$2.55 billion in 2012 increased by 6% over 2011, driven by growth in the Construction, Oil & Gas and
Technology business units. Business retention rates in 2012 remained strong and were virtually level
with 2011. Renewal premium changes remained positive in 2012 and were higher than in 2011,
primarily due to renewal rate increases. New business premiums in 2012 decreased from 2011.
Target Risk Underwriting. Net written premiums of $1.80 billion in 2013 increased by 8% over
2012, driven by the National Property and Inland Marine business units. Business retention rates
remained strong in 2013 and were slightly higher than in 2012. Renewal premium changes remained
positive in 2013 but were lower than in 2012. New business premiums in 2013 increased over 2012. Net
written premiums of $1.67 billion in 2012 increased by 5% over 2011, also driven by the National
Property and Inland Marine business units. Business retention rates in 2012 remained strong but were
91