Travelers 2013 Annual Report Download - page 110
Download and view the complete annual report
Please find page 110 of the 2013 Travelers annual report below. You can navigate through the pages in the report by either clicking on the pages listed below, or by using the keyword search tool below to find specific information within the annual report.-
 1
1 -
2
-
3
-
4
-
5
-
6
-
7
-
8
-
9
-
10
-
11
-
12
-
13
-
14
-
15
-
16
-
17
-
18
-
19
-
20
-
21
-
22
-
23
-
24
-
25
-
26
-
27
-
28
-
29
-
30
-
31
-
32
-
33
-
34
-
35
-
36
-
37
-
38
-
39
-
40
-
41
-
42
-
43
-
44
-
45
-
46
-
47
-
48
-
49
-
50
-
51
-
52
-
53
-
54
-
55
-
56
-
57
-
58
-
59
-
60
-
61
-
62
-
63
-
64
-
65
-
66
-
67
-
68
-
69
-
70
-
71
-
72
-
73
-
74
-
75
-
76
-
77
-
78
-
79
-
80
-
81
-
82
-
83
-
84
-
85
-
86
-
87
-
88
-
89
-
90
-
91
-
92
-
93
-
94
-
95
-
96
-
97
-
98
-
99
-
 100
100 -
 101
101 -
 102
102 -
 103
103 -
 104
104 -
 105
105 -
 106
106 -
 107
107 -
 108
108 -
 109
109 -
 110
110 -
 111
111 -
 112
112 -
 113
113 -
 114
114 -
 115
115 -
 116
116 -
 117
117 -
 118
118 -
 119
119 -
 120
120 -
121
-
122
-
123
-
124
-
125
-
126
-
127
-
128
-
129
-
130
-
131
-
132
-
133
-
134
-
135
-
136
-
137
-
138
-
139
-
140
-
141
-
142
-
143
-
144
-
145
-
146
-
147
-
148
-
149
-
150
-
151
-
152
-
153
-
154
-
155
-
156
-
157
-
158
-
159
-
160
-
161
-
162
-
163
-
164
-
165
-
166
-
167
-
168
-
169
-
170
-
171
-
172
-
173
-
174
-
175
-
176
-
177
-
178
-
179
-
180
-
181
-
182
-
183
-
184
-
185
-
186
-
187
-
188
-
189
-
190
-
191
-
192
-
193
-
194
-
195
-
196
-
197
-
198
-
199
-
200
-
201
-
202
-
203
-
204
-
205
-
206
-
207
-
208
-
209
-
210
-
211
-
212
-
213
-
214
-
215
-
216
-
217
-
218
-
219
-
220
-
221
-
222
-
223
-
224
-
225
-
226
-
227
-
228
-
229
-
230
-
231
-
232
-
233
-
234
-
235
-
236
-
237
-
238
-
239
-
240
-
241
-
242
-
243
-
244
-
245
-
246
-
247
-
248
-
249
-
250
-
251
-
252
-
253
-
254
-
255
-
256
-
257
-
258
-
259
-
260
-
261
-
262
-
263
-
264
-
265
-
266
-
267
-
268
-
269
-
270
-
271
-
272
-
273
-
274
-
275
-
276
-
277
-
278
-
279
-
280
-
281
-
282
-
283
-
284
-
285
-
286
-
287
-
288
-
289
-
290
-
291
-
292
-
293
-
294
-
295
-
296
-
297
-
298
-
299
-
300
-
301
-
302
-
303
-
304
 |
 |

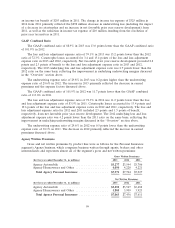
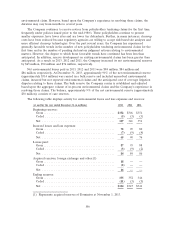
In 2013, gross and net Agency written premiums were 5% lower than in 2012. Renewal rate
changes continued to exceed expected loss cost trends, assuming weather patterns consistent with the
Company’s expectations. In 2012, gross and net Agency written premiums were 2% lower than in 2011.
In 2013 in the Agency Automobile line of business, net written premiums were 8% lower than in
2012. Business retention rates in 2013 remained strong but were slightly lower than in 2012, while new
business premiums in 2013 decreased from 2012, largely as a result of the Company’s continued pricing
strategies and other profitability improvement initiatives. Renewal premium changes in 2013 remained
positive and were higher than in 2012, primarily driven by renewal rate changes. In 2012, net written
premiums were 4% lower than in 2011. Business retention rates remained strong but were lower than
in 2011, while new business premiums in 2012 decreased from 2011, largely as a result of the
Company’s pricing strategy and other profitability improvement initiatives. Renewal premium changes
remained positive in 2012 and were higher than in 2011.
In 2013 in the Agency Homeowners and Other line of business, net written premiums were 3%
lower than in 2012. Business retention rates remained strong but were slightly lower than in 2012.
Renewal premium changes in 2013 remained positive but were slightly lower than in 2012. New
business premiums in 2013 decreased from 2012. Net written premiums in 2012 were slightly lower than
in 2011. Business retention rates remained strong but were lower than in 2011. New business premiums
in 2012 decreased from 2011, largely as a result of the Company’s pricing strategy, higher deductibles
and other profitability improvement initiatives. Renewal premium changes remained positive in 2012
and were higher than in 2011.
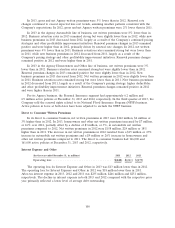
For its Agency business, the Personal Insurance segment had approximately 6.2 million and
6.9 million active policies at December 31, 2013 and 2012, respectively. In the third quarter of 2013, the
Company sold the renewal rights related to its National Flood Insurance Program (NFIP) business.
Active policies in force at both dates have been adjusted to exclude the NFIP business.
Direct to Consumer Written Premiums
In its direct to consumer business, net written premiums in 2013 were $162 million, $4 million or
3% higher than in 2012. In 2013, homeowners and other net written premiums increased by $7 million,
or 16% over 2012, partially offset by a decline of $3 million, or 3%, in automobile net written
premiums compared to 2012. Net written premiums in 2012 were $158 million, $24 million or 18%
higher than in 2011. The increase in net written premiums in 2012 resulted from a $15 million or 15%
increase in automobile net written premiums and a $9 million or 26% increase in homeowners and
other net written premiums compared to 2011. The direct to consumer business had 166,000 and
161,000 active policies at December 31, 2013 and 2012, respectively.
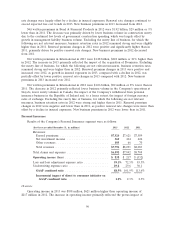
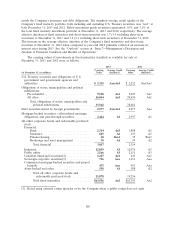
Interest Expense and Other
(for the year ended December 31, in millions) 2013 2012 2011
Operating loss .................................. $(248) $(261) $(279)
The operating loss for Interest Expense and Other in 2013 was $13 million lower than in 2012.
The operating loss for Interest Expense and Other in 2012 was $18 million lower than in 2011.
After-tax interest expense in 2013, 2012 and 2011 was $235 million, $246 million and $251 million,
respectively. The decline in interest expense in both 2013 and 2012 compared with the respective prior
year primarily reflected a lower level of average debt outstanding.
100