Travelers 2013 Annual Report Download - page 93
Download and view the complete annual report
Please find page 93 of the 2013 Travelers annual report below. You can navigate through the pages in the report by either clicking on the pages listed below, or by using the keyword search tool below to find specific information within the annual report.-
 1
1 -
2
-
3
-
4
-
5
-
6
-
7
-
8
-
9
-
10
-
11
-
12
-
13
-
14
-
15
-
16
-
17
-
18
-
19
-
20
-
21
-
22
-
23
-
24
-
25
-
26
-
27
-
28
-
29
-
30
-
31
-
32
-
33
-
34
-
35
-
36
-
37
-
38
-
39
-
40
-
41
-
42
-
43
-
44
-
45
-
46
-
47
-
48
-
49
-
50
-
51
-
52
-
53
-
54
-
55
-
56
-
57
-
58
-
59
-
60
-
61
-
62
-
63
-
64
-
65
-
66
-
67
-
68
-
69
-
70
-
71
-
72
-
73
-
74
-
75
-
76
-
77
-
78
-
79
-
80
-
81
-
82
-
 83
83 -
 84
84 -
 85
85 -
 86
86 -
 87
87 -
 88
88 -
 89
89 -
 90
90 -
 91
91 -
 92
92 -
 93
93 -
 94
94 -
 95
95 -
 96
96 -
 97
97 -
 98
98 -
 99
99 -
 100
100 -
 101
101 -
 102
102 -
 103
103 -
104
-
105
-
106
-
107
-
108
-
109
-
110
-
111
-
112
-
113
-
114
-
115
-
116
-
117
-
118
-
119
-
120
-
121
-
122
-
123
-
124
-
125
-
126
-
127
-
128
-
129
-
130
-
131
-
132
-
133
-
134
-
135
-
136
-
137
-
138
-
139
-
140
-
141
-
142
-
143
-
144
-
145
-
146
-
147
-
148
-
149
-
150
-
151
-
152
-
153
-
154
-
155
-
156
-
157
-
158
-
159
-
160
-
161
-
162
-
163
-
164
-
165
-
166
-
167
-
168
-
169
-
170
-
171
-
172
-
173
-
174
-
175
-
176
-
177
-
178
-
179
-
180
-
181
-
182
-
183
-
184
-
185
-
186
-
187
-
188
-
189
-
190
-
191
-
192
-
193
-
194
-
195
-
196
-
197
-
198
-
199
-
200
-
201
-
202
-
203
-
204
-
205
-
206
-
207
-
208
-
209
-
210
-
211
-
212
-
213
-
214
-
215
-
216
-
217
-
218
-
219
-
220
-
221
-
222
-
223
-
224
-
225
-
226
-
227
-
228
-
229
-
230
-
231
-
232
-
233
-
234
-
235
-
236
-
237
-
238
-
239
-
240
-
241
-
242
-
243
-
244
-
245
-
246
-
247
-
248
-
249
-
250
-
251
-
252
-
253
-
254
-
255
-
256
-
257
-
258
-
259
-
260
-
261
-
262
-
263
-
264
-
265
-
266
-
267
-
268
-
269
-
270
-
271
-
272
-
273
-
274
-
275
-
276
-
277
-
278
-
279
-
280
-
281
-
282
-
283
-
284
-
285
-
286
-
287
-
288
-
289
-
290
-
291
-
292
-
293
-
294
-
295
-
296
-
297
-
298
-
299
-
300
-
301
-
302
-
303
-
304
 |
 |
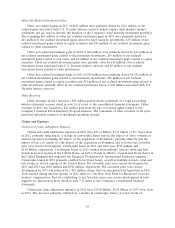
Other Net Realized Investment Gains
Other net realized gains in 2013 of $181 million were primarily driven by $115 million of net
realized gains associated with U.S. Treasury futures contracts (which require daily mark-to-market
settlement and are used to shorten the duration of the Company’s fixed maturity investment portfolio).
The remaining $66 million of other net realized investment gains in 2013 were primarily driven by
$41 million of net realized investment gains related to fixed maturity investments, $15 million of net
realized investment gains related to equity securities and $10 million of net realized investment gains
related to other investments.
Other net realized investment gains in 2012 of $66 million were primarily driven by $61 million of
net realized investment gains related to fixed maturity investments, $19 million of net realized
investment gains related to real estate and $8 million of net realized investment gains related to equity
securities. These net realized investment gains were partially offset by $14 million of net realized
investment losses associated with U.S. Treasury futures contracts and $8 million of net realized
investment losses related to other investments.
Other net realized investment gains in 2011 of $80 million were primarily driven by $52 million of
net realized investment gains related to fixed maturity investments, $46 million of net realized
investment gains related to equity securities and $41 million of net realized investment gains related to
other investments, partially offset by net realized investment losses of $62 million associated with U.S.
Treasury futures contracts.
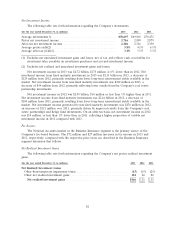
Other Revenues
Other revenues in 2013 included a $91 million gain from the settlement of a legal proceeding,
which is discussed in more detail in note 16 of notes to the consolidated financial statements. Other
revenues in 2013 also included a $20 million gain from the sale of renewal rights related to the
Company’s National Flood Insurance Program business. The remainder of other revenues in all years
presented primarily consisted of installment premium charges.
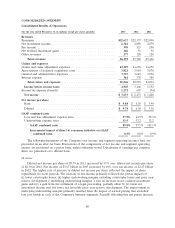
Claims and Expenses
Claims and Claim Adjustment Expenses
Claims and claim adjustment expenses in 2013 were $13.31 billion, $1.37 billion or 9% lower than
in 2012, primarily reflecting (i) a decline in catastrophe losses and (ii) the impact of lower volumes of
insured exposures (excluding the impact of the acquisition of Dominion), partially offset by (iii) the
impact of loss cost trends, (iv) the impact of the acquisition of Dominion and (v) lower net favorable
prior year reserve development. Catastrophe losses in 2013 and 2012 were $591 million and
$1.86 billion, respectively. Catastrophe losses in 2013 resulted from multiple tornado, wind and hail
storms in several regions of the United States, as well as floods in Alberta, Canada and Storm Xaver in
the United Kingdom that impacted the Financial, Professional & International Insurance segment.
Catastrophe losses in 2012 primarily resulted from Storm Sandy, as well as multiple tornado, wind and
hail storms in several regions of the United States. Net favorable prior year reserve development in
2013 and 2012 was $840 million and $940 million, respectively. Net favorable prior year reserve
development in 2013 was reduced by a $42 million charge that was precipitated by legislation in New
York enacted during the first quarter of 2013 related to the New York Fund for Reopened Cases for
workers’ compensation. Factors contributing to net favorable prior year reserve development in each
segment are discussed in more detail in note 7 of notes to the Company’s consolidated financial
statements.
Claims and claim adjustment expenses in 2012 were $14.68 billion, $1.60 billion or 10% lower than
in 2011. The decrease primarily reflected (i) a decline in catastrophe losses, (ii) lower levels of
83