Travelers 2013 Annual Report Download - page 149
Download and view the complete annual report
Please find page 149 of the 2013 Travelers annual report below. You can navigate through the pages in the report by either clicking on the pages listed below, or by using the keyword search tool below to find specific information within the annual report.-
 1
1 -
2
-
3
-
4
-
5
-
6
-
7
-
8
-
9
-
10
-
11
-
12
-
13
-
14
-
15
-
16
-
17
-
18
-
19
-
20
-
21
-
22
-
23
-
24
-
25
-
26
-
27
-
28
-
29
-
30
-
31
-
32
-
33
-
34
-
35
-
36
-
37
-
38
-
39
-
40
-
41
-
42
-
43
-
44
-
45
-
46
-
47
-
48
-
49
-
50
-
51
-
52
-
53
-
54
-
55
-
56
-
57
-
58
-
59
-
60
-
61
-
62
-
63
-
64
-
65
-
66
-
67
-
68
-
69
-
70
-
71
-
72
-
73
-
74
-
75
-
76
-
77
-
78
-
79
-
80
-
81
-
82
-
83
-
84
-
85
-
86
-
87
-
88
-
89
-
90
-
91
-
92
-
93
-
94
-
95
-
96
-
97
-
98
-
99
-
100
-
101
-
102
-
103
-
104
-
105
-
106
-
107
-
108
-
109
-
110
-
111
-
112
-
113
-
114
-
115
-
116
-
117
-
118
-
119
-
120
-
121
-
122
-
123
-
124
-
125
-
126
-
127
-
128
-
129
-
130
-
131
-
132
-
133
-
134
-
135
-
136
-
137
-
138
-
 139
139 -
 140
140 -
 141
141 -
 142
142 -
 143
143 -
 144
144 -
 145
145 -
 146
146 -
 147
147 -
 148
148 -
 149
149 -
 150
150 -
 151
151 -
 152
152 -
 153
153 -
 154
154 -
 155
155 -
 156
156 -
 157
157 -
 158
158 -
 159
159 -
160
-
161
-
162
-
163
-
164
-
165
-
166
-
167
-
168
-
169
-
170
-
171
-
172
-
173
-
174
-
175
-
176
-
177
-
178
-
179
-
180
-
181
-
182
-
183
-
184
-
185
-
186
-
187
-
188
-
189
-
190
-
191
-
192
-
193
-
194
-
195
-
196
-
197
-
198
-
199
-
200
-
201
-
202
-
203
-
204
-
205
-
206
-
207
-
208
-
209
-
210
-
211
-
212
-
213
-
214
-
215
-
216
-
217
-
218
-
219
-
220
-
221
-
222
-
223
-
224
-
225
-
226
-
227
-
228
-
229
-
230
-
231
-
232
-
233
-
234
-
235
-
236
-
237
-
238
-
239
-
240
-
241
-
242
-
243
-
244
-
245
-
246
-
247
-
248
-
249
-
250
-
251
-
252
-
253
-
254
-
255
-
256
-
257
-
258
-
259
-
260
-
261
-
262
-
263
-
264
-
265
-
266
-
267
-
268
-
269
-
270
-
271
-
272
-
273
-
274
-
275
-
276
-
277
-
278
-
279
-
280
-
281
-
282
-
283
-
284
-
285
-
286
-
287
-
288
-
289
-
290
-
291
-
292
-
293
-
294
-
295
-
296
-
297
-
298
-
299
-
300
-
301
-
302
-
303
-
304
 |
 |

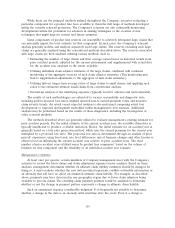
While these are the principal methods utilized throughout the Company, actuaries evaluating a
particular component for a product line have available to them the full range of methods developed
within the casualty actuarial profession. The Company’s actuaries are also continually monitoring
developments within the profession for advances in existing techniques or the creation of new
techniques that might improve current and future estimates.
Some components of product line reserves are susceptible to relatively infrequent large claims that
can materially impact the total estimate for that component. In such cases, the Company’s actuarial
analysis generally isolates and analyzes separately such large claims. The reserves excluding such large
claims are generally analyzed using the conventional methods described above. The reserves associated
with large claims are then analyzed utilizing various methods, such as:
• Estimating the number of large claims and their average values based on historical trends from
prior accident periods, adjusted for the current environment and supplemented with actual data
for the accident year analyzed to the extent available.
• Utilizing individual claim adjuster estimates of the large claims, combined with continual
monitoring of the aggregate accuracy of such claim adjuster estimates. (This monitoring may
lead to supplemental adjustments to the aggregate of such claim estimates.)
• Utilizing historic longer-term average ratios of large claims to small claims, and applying such
ratios to the estimated ultimate small claims from conventional analysis.
• Ground-up analysis of the underlying exposure (typically used for asbestos and environmental).
The results of such methodologies are subjected to various reasonability and diagnostic tests,
including paid-to-incurred loss ratios, implied incurred-loss-to-earned-premium ratios and non-zero
claim severity trends. An actual versus expected analysis is also performed comparing actual loss
development to expected development embedded within management’s best estimate. Additional
analyses may be performed based on the results of these diagnostics, including the investigation of
other actuarial methods.
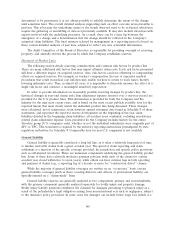
The methods described above are generally utilized to evaluate management’s existing estimate for
prior accident periods. For the initial estimate of the current accident year, the available claim data is
typically insufficient to produce a reliable indication. Hence, the initial estimate for an accident year is
generally based on a loss ratio projection method, which uses the earned premium for the current year
multiplied by a projected loss ratio. The projected loss ratio is determined through an analysis of prior
periods’ experience, using loss trend, rate level differences, mix of business changes and other known or
observed factors influencing the current accident year relative to prior accident years. The exact
number of prior accident years utilized varies by product line component, based on the volume of
business for that component and the reliability of an individual accident year estimate.
Management’s estimates
At least once per quarter, certain members of Company management meet with the Company’s
actuaries to review the latest claims and claim adjustment expense reserve analyses. Based on these
analyses, management determines whether its ultimate claim liability estimates should be changed. In
doing so, it must evaluate whether the new data provided represents credible actionable information or
an anomaly that will have no effect on estimated ultimate claim liability. For example, as described
above, payments may have decreased in one geographic region due to fewer claim adjusters being
available to process claims. The resulting claim payment patterns would be analyzed to determine
whether or not the change in payment pattern represents a change in ultimate claim liability.
Such an assessment requires considerable judgment. It is frequently not possible to determine
whether a change in the data is an anomaly until sometime after the event. Even if a change is
139