Travelers 2013 Annual Report Download - page 199
Download and view the complete annual report
Please find page 199 of the 2013 Travelers annual report below. You can navigate through the pages in the report by either clicking on the pages listed below, or by using the keyword search tool below to find specific information within the annual report.-
 1
1 -
 2
2 -
 3
3 -
 4
4 -
 5
5 -
 6
6 -
 7
7 -
 8
8 -
 9
9 -
 10
10 -
 11
11 -
 12
12 -
 13
13 -
 14
14 -
 15
15 -
 16
16 -
 17
17 -
 18
18 -
 19
19 -
 20
20 -
 21
21 -
 22
22 -
 23
23 -
 24
24 -
 25
25 -
 26
26 -
 27
27 -
 28
28 -
 29
29 -
 30
30 -
 31
31 -
 32
32 -
 33
33 -
 34
34 -
 35
35 -
 36
36 -
 37
37 -
 38
38 -
 39
39 -
 40
40 -
 41
41 -
 42
42 -
 43
43 -
 44
44 -
 45
45 -
 46
46 -
 47
47 -
 48
48 -
 49
49 -
 50
50 -
 51
51 -
 52
52 -
 53
53 -
 54
54 -
 55
55 -
 56
56 -
 57
57 -
 58
58 -
 59
59 -
 60
60 -
 61
61 -
 62
62 -
 63
63 -
 64
64 -
 65
65 -
 66
66 -
 67
67 -
 68
68 -
 69
69 -
 70
70 -
 71
71 -
 72
72 -
 73
73 -
 74
74 -
 75
75 -
 76
76 -
 77
77 -
 78
78 -
 79
79 -
 80
80 -
 81
81 -
 82
82 -
 83
83 -
 84
84 -
 85
85 -
 86
86 -
 87
87 -
 88
88 -
 89
89 -
 90
90 -
 91
91 -
 92
92 -
 93
93 -
 94
94 -
 95
95 -
 96
96 -
 97
97 -
 98
98 -
 99
99 -
 100
100 -
 101
101 -
 102
102 -
 103
103 -
 104
104 -
 105
105 -
 106
106 -
 107
107 -
 108
108 -
 109
109 -
 110
110 -
 111
111 -
 112
112 -
 113
113 -
 114
114 -
 115
115 -
 116
116 -
 117
117 -
 118
118 -
 119
119 -
 120
120 -
 121
121 -
 122
122 -
 123
123 -
 124
124 -
 125
125 -
 126
126 -
 127
127 -
 128
128 -
 129
129 -
 130
130 -
 131
131 -
 132
132 -
 133
133 -
 134
134 -
 135
135 -
 136
136 -
 137
137 -
 138
138 -
 139
139 -
 140
140 -
 141
141 -
 142
142 -
 143
143 -
 144
144 -
 145
145 -
 146
146 -
 147
147 -
 148
148 -
 149
149 -
 150
150 -
 151
151 -
 152
152 -
 153
153 -
 154
154 -
 155
155 -
 156
156 -
 157
157 -
 158
158 -
 159
159 -
 160
160 -
 161
161 -
 162
162 -
 163
163 -
 164
164 -
 165
165 -
 166
166 -
 167
167 -
 168
168 -
 169
169 -
 170
170 -
 171
171 -
 172
172 -
 173
173 -
 174
174 -
 175
175 -
 176
176 -
 177
177 -
 178
178 -
 179
179 -
 180
180 -
 181
181 -
 182
182 -
 183
183 -
 184
184 -
 185
185 -
 186
186 -
 187
187 -
 188
188 -
 189
189 -
 190
190 -
 191
191 -
 192
192 -
 193
193 -
 194
194 -
 195
195 -
 196
196 -
 197
197 -
 198
198 -
 199
199 -
 200
200 -
 201
201 -
 202
202 -
 203
203 -
 204
204 -
 205
205 -
 206
206 -
 207
207 -
 208
208 -
 209
209 -
 210
210 -
 211
211 -
 212
212 -
 213
213 -
 214
214 -
 215
215 -
 216
216 -
 217
217 -
 218
218 -
 219
219 -
 220
220 -
 221
221 -
 222
222 -
 223
223 -
 224
224 -
 225
225 -
 226
226 -
 227
227 -
 228
228 -
 229
229 -
 230
230 -
 231
231 -
 232
232 -
 233
233 -
 234
234 -
 235
235 -
 236
236 -
 237
237 -
 238
238 -
 239
239 -
 240
240 -
 241
241 -
 242
242 -
 243
243 -
 244
244 -
 245
245 -
 246
246 -
 247
247 -
 248
248 -
 249
249 -
 250
250 -
 251
251 -
 252
252 -
 253
253 -
 254
254 -
 255
255 -
 256
256 -
 257
257 -
 258
258 -
 259
259 -
 260
260 -
 261
261 -
 262
262 -
 263
263 -
 264
264 -
 265
265 -
 266
266 -
 267
267 -
 268
268 -
 269
269 -
 270
270 -
 271
271 -
 272
272 -
 273
273 -
 274
274 -
 275
275 -
 276
276 -
 277
277 -
 278
278 -
 279
279 -
 280
280 -
 281
281 -
 282
282 -
 283
283 -
 284
284 -
 285
285 -
 286
286 -
 287
287 -
 288
288 -
 289
289 -
 290
290 -
 291
291 -
 292
292 -
 293
293 -
 294
294 -
 295
295 -
 296
296 -
 297
297 -
 298
298 -
 299
299 -
 300
300 -
 301
301 -
 302
302 -
 303
303 -
 304
304
 |
 |

THE TRAVELERS COMPANIES, INC. AND SUBSIDIARIES
NOTES TO CONSOLIDATED FINANCIAL STATEMENTS (Continued)
3. INVESTMENTS (Continued)
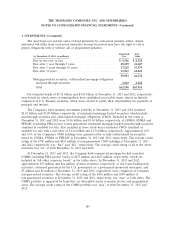
The amortized cost and fair value of fixed maturities by contractual maturity follow. Actual
maturities will differ from contractual maturities because borrowers may have the right to call or
prepay obligations with or without call or prepayment penalties.
Amortized Fair
(at December 31, 2013, in millions) Cost Value
Due in one year or less .............................. $ 8,386 $ 8,525
Due after 1 year through 5 years ....................... 20,359 21,407
Due after 5 years through 10 years ...................... 17,225 17,579
Due after 10 years .................................. 13,963 14,021
59,933 61,532
Mortgage-backed securities, collateralized mortgage obligations
and pass-through securities .......................... 2,263 2,424
Total .......................................... $62,196 $63,956
Pre-refunded bonds of $9.52 billion and $9.03 billion at December 31, 2013 and 2012, respectively,
were bonds for which states or municipalities have established irrevocable trusts, almost exclusively
comprised of U.S. Treasury securities, which were created to satisfy their responsibility for payments of
principal and interest.
The Company’s fixed maturity investment portfolio at December 31, 2013 and 2012 included
$2.42 billion and $3.00 billion, respectively, of residential mortgage-backed securities, which include
pass-through securities and collateralized mortgage obligations (CMO). Included in the totals at
December 31, 2013 and 2012 were $1.06 billion and $1.44 billion, respectively, of GNMA, FNMA and
FHLMC (excluding FHA project loans) guaranteed residential mortgage-backed pass-through securities
classified as available for sale. Also included in those totals were residential CMOs classified as
available for sale with a fair value of $1.36 billion and $1.56 billion, respectively. Approximately 42%
and 43% of the Company’s CMO holdings were guaranteed by or fully collateralized by securities
issued by GNMA, FNMA or FHLMC at December 31, 2013 and 2012, respectively. The average credit
rating of the $790 million and $893 million of non-guaranteed CMO holdings at December 31, 2013
and 2012, respectively, was ‘‘Ba3’’ and ‘‘B2,’’ respectively. The average credit rating of all of the above
securities was ‘‘A1’’ at both December 31, 2013 and 2012.
At December 31, 2013 and 2012, the Company held commercial mortgage-backed securities
(CMBS, including FHA project loans) of $475 million and $453 million, respectively, which are
included in ‘‘All other corporate bonds’’ in the tables above. At December 31, 2013 and 2012,
approximately $59 million and $64 million of these securities, respectively, or the loans backing such
securities, contained guarantees by the U.S. government or a government-sponsored enterprise, and
$7 million and $4 million at December 31, 2013 and 2012, respectively, were comprised of Canadian
non-guaranteed securities. The average credit rating of the $416 million and $389 million of
non-guaranteed securities at December 31, 2013 and 2012, respectively, was ‘‘Aaa’’ at both dates. The
CMBS portfolio is supported by loans that are diversified across economic sectors and geographical
areas. The average credit rating of the CMBS portfolio was ‘‘Aaa’’ at both December 31, 2013 and
2012.
189
