Travelers 2013 Annual Report Download - page 269
Download and view the complete annual report
Please find page 269 of the 2013 Travelers annual report below. You can navigate through the pages in the report by either clicking on the pages listed below, or by using the keyword search tool below to find specific information within the annual report.-
 1
1 -
2
-
3
-
4
-
5
-
6
-
7
-
8
-
9
-
10
-
11
-
12
-
13
-
14
-
15
-
16
-
17
-
18
-
19
-
20
-
21
-
22
-
23
-
24
-
25
-
26
-
27
-
28
-
29
-
30
-
31
-
32
-
33
-
34
-
35
-
36
-
37
-
38
-
39
-
40
-
41
-
42
-
43
-
44
-
45
-
46
-
47
-
48
-
49
-
50
-
51
-
52
-
53
-
54
-
55
-
56
-
57
-
58
-
59
-
60
-
61
-
62
-
63
-
64
-
65
-
66
-
67
-
68
-
69
-
70
-
71
-
72
-
73
-
74
-
75
-
76
-
77
-
78
-
79
-
80
-
81
-
82
-
83
-
84
-
85
-
86
-
87
-
88
-
89
-
90
-
91
-
92
-
93
-
94
-
95
-
96
-
97
-
98
-
99
-
100
-
101
-
102
-
103
-
104
-
105
-
106
-
107
-
108
-
109
-
110
-
111
-
112
-
113
-
114
-
115
-
116
-
117
-
118
-
119
-
120
-
121
-
122
-
123
-
124
-
125
-
126
-
127
-
128
-
129
-
130
-
131
-
132
-
133
-
134
-
135
-
136
-
137
-
138
-
139
-
140
-
141
-
142
-
143
-
144
-
145
-
146
-
147
-
148
-
149
-
150
-
151
-
152
-
153
-
154
-
155
-
156
-
157
-
158
-
159
-
160
-
161
-
162
-
163
-
164
-
165
-
166
-
167
-
168
-
169
-
170
-
171
-
172
-
173
-
174
-
175
-
176
-
177
-
178
-
179
-
180
-
181
-
182
-
183
-
184
-
185
-
186
-
187
-
188
-
189
-
190
-
191
-
192
-
193
-
194
-
195
-
196
-
197
-
198
-
199
-
200
-
201
-
202
-
203
-
204
-
205
-
206
-
207
-
208
-
209
-
210
-
211
-
212
-
213
-
214
-
215
-
216
-
217
-
218
-
219
-
220
-
221
-
222
-
223
-
224
-
225
-
226
-
227
-
228
-
229
-
230
-
231
-
232
-
233
-
234
-
235
-
236
-
237
-
238
-
239
-
240
-
241
-
242
-
243
-
244
-
245
-
246
-
247
-
248
-
249
-
250
-
251
-
252
-
253
-
254
-
255
-
256
-
257
-
258
-
 259
259 -
 260
260 -
 261
261 -
 262
262 -
 263
263 -
 264
264 -
 265
265 -
 266
266 -
 267
267 -
 268
268 -
 269
269 -
 270
270 -
 271
271 -
 272
272 -
 273
273 -
 274
274 -
 275
275 -
 276
276 -
 277
277 -
 278
278 -
 279
279 -
280
-
281
-
282
-
283
-
284
-
285
-
286
-
287
-
288
-
289
-
290
-
291
-
292
-
293
-
294
-
295
-
296
-
297
-
298
-
299
-
300
-
301
-
302
-
303
-
304
 |
 |

THE TRAVELERS COMPANIES, INC. AND SUBSIDIARIES
NOTES TO CONSOLIDATED FINANCIAL STATEMENTS (Continued)
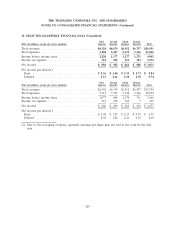
19. SELECTED QUARTERLY FINANCIAL DATA (Unaudited)
First Second Third Fourth
2013 (in millions, except per share amounts) Quarter Quarter Quarter Quarter Total
Total revenues ............................... $6,328 $6,674 $6,452 $6,737 $26,191
Total expenses ............................... 5,108 5,497 5,275 5,366 21,246
Income before income taxes ..................... 1,220 1,177 1,177 1,371 4,945
Income tax expense ........................... 324 252 313 383 1,272
Net income ................................. $ 896 $ 925 $ 864 $ 988 $ 3,673
Net income per share(1):
Basic .................................... $ 2.36 $ 2.44 $ 2.33 $ 2.73 $ 9.84
Diluted ................................... 2.33 2.41 2.30 2.70 9.74
First Second Third Fourth
2012 (in millions, except per share amounts) Quarter Quarter Quarter Quarter Total
Total revenues ............................... $6,392 $6,359 $6,512 $6,477 $25,740
Total expenses ............................... 5,315 5,751 5,342 6,166 22,574
Income before income taxes ..................... 1,077 608 1,170 311 3,166
Income tax expense ........................... 271 109 306 7 693
Net income ................................. $ 806 $ 499 $ 864 $ 304 $ 2,473
Net income per share(1):
Basic .................................... $ 2.04 $ 1.27 $ 2.23 $ 0.79 $ 6.35
Diluted ................................... 2.02 1.26 2.21 0.78 6.30
(1) Due to the averaging of shares, quarterly earnings per share may not add to the total for the full
year.
259