Travelers 2013 Annual Report Download - page 302
Download and view the complete annual report
Please find page 302 of the 2013 Travelers annual report below. You can navigate through the pages in the report by either clicking on the pages listed below, or by using the keyword search tool below to find specific information within the annual report.-
 1
1 -
2
-
3
-
4
-
5
-
6
-
7
-
8
-
9
-
10
-
11
-
12
-
13
-
14
-
15
-
16
-
17
-
18
-
19
-
20
-
21
-
22
-
23
-
24
-
25
-
26
-
27
-
28
-
29
-
30
-
31
-
32
-
33
-
34
-
35
-
36
-
37
-
38
-
39
-
40
-
41
-
42
-
43
-
44
-
45
-
46
-
47
-
48
-
49
-
50
-
51
-
52
-
53
-
54
-
55
-
56
-
57
-
58
-
59
-
60
-
61
-
62
-
63
-
64
-
65
-
66
-
67
-
68
-
69
-
70
-
71
-
72
-
73
-
74
-
75
-
76
-
77
-
78
-
79
-
80
-
81
-
82
-
83
-
84
-
85
-
86
-
87
-
88
-
89
-
90
-
91
-
92
-
93
-
94
-
95
-
96
-
97
-
98
-
99
-
100
-
101
-
102
-
103
-
104
-
105
-
106
-
107
-
108
-
109
-
110
-
111
-
112
-
113
-
114
-
115
-
116
-
117
-
118
-
119
-
120
-
121
-
122
-
123
-
124
-
125
-
126
-
127
-
128
-
129
-
130
-
131
-
132
-
133
-
134
-
135
-
136
-
137
-
138
-
139
-
140
-
141
-
142
-
143
-
144
-
145
-
146
-
147
-
148
-
149
-
150
-
151
-
152
-
153
-
154
-
155
-
156
-
157
-
158
-
159
-
160
-
161
-
162
-
163
-
164
-
165
-
166
-
167
-
168
-
169
-
170
-
171
-
172
-
173
-
174
-
175
-
176
-
177
-
178
-
179
-
180
-
181
-
182
-
183
-
184
-
185
-
186
-
187
-
188
-
189
-
190
-
191
-
192
-
193
-
194
-
195
-
196
-
197
-
198
-
199
-
200
-
201
-
202
-
203
-
204
-
205
-
206
-
207
-
208
-
209
-
210
-
211
-
212
-
213
-
214
-
215
-
216
-
217
-
218
-
219
-
220
-
221
-
222
-
223
-
224
-
225
-
226
-
227
-
228
-
229
-
230
-
231
-
232
-
233
-
234
-
235
-
236
-
237
-
238
-
239
-
240
-
241
-
242
-
243
-
244
-
245
-
246
-
247
-
248
-
249
-
250
-
251
-
252
-
253
-
254
-
255
-
256
-
257
-
258
-
259
-
260
-
261
-
262
-
263
-
264
-
265
-
266
-
267
-
268
-
269
-
270
-
271
-
272
-
273
-
274
-
275
-
276
-
277
-
278
-
279
-
280
-
281
-
282
-
283
-
284
-
285
-
286
-
287
-
288
-
289
-
290
-
291
-
 292
292 -
 293
293 -
 294
294 -
 295
295 -
 296
296 -
 297
297 -
 298
298 -
 299
299 -
 300
300 -
 301
301 -
 302
302 -
 303
303 -
 304
304
 |
 |

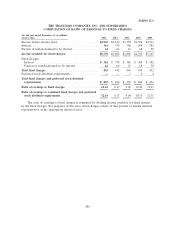
As of December 31,
(Dollars in millions) 2012 2011 2010 2009 2008 2007 2006 2005 2004
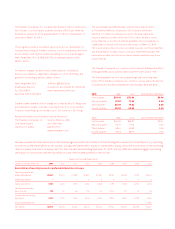
Reconciliation of adjusted shareholders’ equity to shareholders’ equity
Adjusted shareholders’ equity $22,270 $21,570 $23,375 $25,458 $25,647 $25,783 $24,545 $22,227 $20,087
Net unrealized investment
gains (losses), net of tax 3,103 2,871 1,859 1,856 (146) 620 453 327 866
Net realized investment
gains (losses), net of tax 32 36 173 22 (271) 101 8 35 (28)
Preferred stock – – 68 79 89 112 129 153 188
Discontinued operations – – – – – – – (439) 88
Shareholders’ equity $25,405 $24,477 $25,475 $27,415 $25,319 $26,616 $25,135 $22,303 $21,201
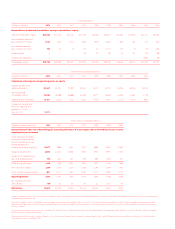
Twelve months ended December 31,
(Dollars in millions) 2012 2011 2010 2009 2008 2007 2006 2005
Calculation of average annual operating return on equity
Operating income, less
preferred dividends $2,441 $1,389 $3,040 $3,597 $3,191 $4,496 $4,195 $2,020
Adjusted average
shareholders’ equity 24,285 25,777 25,668 25,350 23,381 21,118
Operating return on equity % 11.0% 6.1% 12.5% 14.0% 12.4% 17.7% 17.9% 9.6%
Average annual operating
return on equity for the
period Jan. 1, 2005 –
Dec. 31, 2013 %
Twelve months ended December 31,
(Dollars in millions, after-tax) 2012 2011 2010 2009 2008 2007
Reconciliation of aftertax underwriting gain excluding the impact of catastrophes and net favorable prior year reserve
development to net income
Underwriting gain excluding
the impact of catastrophes
and net favorable prior year
reserve development
(underlying underwriting gain) $888 $451 $715 $866 $995 $1,457
Impact of catastrophes (1,214) (1,669) (729) (297) (919) (109)
Impact of net favorable prior
year reserve development 622 473 818 868 1,000 351
Underwriting gain (loss) 296 (745) 804 1,437 1,076 1,699
Net investment income 2,316 2,330 2,468 2,290 2,299 2,915
Other, including interest expense (171) (195) (229) (127) (180) (114)
Operating income 2,441 1,390 3,043 3,600 3,195 4,500
Net realized investment
gains (losses) 32 36 173 22 (271) 101
Net income $2,473 $1,426 $3,216 $3,622 2,924 4,601
Average shareholders’ equity is (a) the sum of total shareholders’ equity excluding preferred stock at the beginning and end of each of the quarters for the period presented divided by (b) the number of quarters
in the period presented times two.
Adjusted shareholders’ equity is shareholders’ equity excluding net unrealized investment gains (losses), net of tax, net realized investment gains (losses), net of tax, for the period presented, preferred stock
and discontinued operations. Adjusted average shareholders’ equity is average shareholders’ equity excluding net unrealized investment gains (losses), net of tax, and that period’s net realized investment gains
(losses), net of tax.
Average annual operating return on equity over a period is the ratio of: (a) the sum of operating income less preferred dividends for the periods presented, to (b) the sum of the adjusted average shareholders’
equity for all years in the period presented.
Defi nitions of other terms used in this Annual Report, such as return on equity, operating return on equity, underwriting gain (loss) and GAAP combined ratio, are included in the Glossary of Selected Insurance
Terms portion of the attached Form 10-K.