Travelers 2013 Annual Report Download - page 94
Download and view the complete annual report
Please find page 94 of the 2013 Travelers annual report below. You can navigate through the pages in the report by either clicking on the pages listed below, or by using the keyword search tool below to find specific information within the annual report.-
 1
1 -
2
-
3
-
4
-
5
-
6
-
7
-
8
-
9
-
10
-
11
-
12
-
13
-
14
-
15
-
16
-
17
-
18
-
19
-
20
-
21
-
22
-
23
-
24
-
25
-
26
-
27
-
28
-
29
-
30
-
31
-
32
-
33
-
34
-
35
-
36
-
37
-
38
-
39
-
40
-
41
-
42
-
43
-
44
-
45
-
46
-
47
-
48
-
49
-
50
-
51
-
52
-
53
-
54
-
55
-
56
-
57
-
58
-
59
-
60
-
61
-
62
-
63
-
64
-
65
-
66
-
67
-
68
-
69
-
70
-
71
-
72
-
73
-
74
-
75
-
76
-
77
-
78
-
79
-
80
-
81
-
82
-
83
-
 84
84 -
 85
85 -
 86
86 -
 87
87 -
 88
88 -
 89
89 -
 90
90 -
 91
91 -
 92
92 -
 93
93 -
 94
94 -
 95
95 -
 96
96 -
 97
97 -
 98
98 -
 99
99 -
 100
100 -
 101
101 -
 102
102 -
 103
103 -
 104
104 -
105
-
106
-
107
-
108
-
109
-
110
-
111
-
112
-
113
-
114
-
115
-
116
-
117
-
118
-
119
-
120
-
121
-
122
-
123
-
124
-
125
-
126
-
127
-
128
-
129
-
130
-
131
-
132
-
133
-
134
-
135
-
136
-
137
-
138
-
139
-
140
-
141
-
142
-
143
-
144
-
145
-
146
-
147
-
148
-
149
-
150
-
151
-
152
-
153
-
154
-
155
-
156
-
157
-
158
-
159
-
160
-
161
-
162
-
163
-
164
-
165
-
166
-
167
-
168
-
169
-
170
-
171
-
172
-
173
-
174
-
175
-
176
-
177
-
178
-
179
-
180
-
181
-
182
-
183
-
184
-
185
-
186
-
187
-
188
-
189
-
190
-
191
-
192
-
193
-
194
-
195
-
196
-
197
-
198
-
199
-
200
-
201
-
202
-
203
-
204
-
205
-
206
-
207
-
208
-
209
-
210
-
211
-
212
-
213
-
214
-
215
-
216
-
217
-
218
-
219
-
220
-
221
-
222
-
223
-
224
-
225
-
226
-
227
-
228
-
229
-
230
-
231
-
232
-
233
-
234
-
235
-
236
-
237
-
238
-
239
-
240
-
241
-
242
-
243
-
244
-
245
-
246
-
247
-
248
-
249
-
250
-
251
-
252
-
253
-
254
-
255
-
256
-
257
-
258
-
259
-
260
-
261
-
262
-
263
-
264
-
265
-
266
-
267
-
268
-
269
-
270
-
271
-
272
-
273
-
274
-
275
-
276
-
277
-
278
-
279
-
280
-
281
-
282
-
283
-
284
-
285
-
286
-
287
-
288
-
289
-
290
-
291
-
292
-
293
-
294
-
295
-
296
-
297
-
298
-
299
-
300
-
301
-
302
-
303
-
304
 |
 |

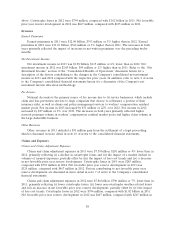
non-catastrophe weather-related losses and (iii) higher net favorable prior year reserve development,
partially offset by (iv) the impact of loss cost trends. Catastrophe losses in 2012 and 2011 were
$1.86 billion and $2.56 billion, respectively. Catastrophe losses in 2011 primarily resulted from
Hurricane Irene and Tropical Storm Lee, multiple tornadoes and hail storms in the Midwest and
Southeast regions of the United States and severe winter storms throughout the United States.
Catastrophe losses in 2011 also included losses from floods in Thailand and an earthquake in Japan
that impacted the Financial, Professional & International Insurance segment. Net favorable prior year
reserve development in 2012 and 2011 was $940 million and $715 million, respectively. Factors
contributing to net favorable prior year reserve development in each segment are discussed in more
detail in note 7 of notes to the Company’s consolidated financial statements.
Significant Catastrophe Losses
The Company defines a ‘‘catastrophe’’ as an event that:
• is designated a catastrophe by internationally recognized organizations that track and report on
insured losses from catastrophic events, such as Property Claim Services (PCS) for events in the
United States and Canada; and
• the Company’s estimates of its ultimate losses before reinsurance and taxes exceed a
pre-established dollar threshold.
The Company’s threshold for disclosing catastrophes is determined at its reportable segment level,
or at a combination thereof, and ranged from approximately $17 million to $30 million of losses before
reinsurance and taxes.
The following table presents for significant catastrophes the amount of losses recorded in each of
the years ended December 31, 2013, 2012, and 2011, and the amount of related net unfavorable
(favorable) prior year reserve development recognized in subsequent years. For purposes of the table, a
significant catastrophe is an event for which the Company estimates its ultimate losses will be
$100 million or more after reinsurance and before taxes.
(for the year ended December 31, in millions, pretax and net of reinsurance) 2013 2012 2011
2011
PCS Serial Number:
35—Severe winter storms ...................................... $ (6) $ 1 $100
42—Severe thunderstorms and tornadoes ........................... (2) (5) 130
43—Severe thunderstorms and tornadoes ........................... (1) 2 149
44—Severe thunderstorms and tornadoes ........................... (9) (10) 121
46—Severe thunderstorms and tornadoes (including Tuscaloosa, AL) ....... 2 (76) 648
48—Severe thunderstorms and tornadoes (including Joplin, MO) .......... (14) (24) 430
59—Hurricane Irene .......................................... (17) (47) 375
61—Tropical Storm Lee ....................................... (21) (7) 119
2012
PCS Serial Number:
67—Severe wind and hail storms ................................. (2) 140
74—Severe wind and hail storms ................................. (20) 171
76—Severe wind and hail storms ................................. (10) 148
83—Severe wind storms ....................................... 2 136
90—Storm Sandy ............................................ (52) 1,024
2013
PCS Serial Number:
93—Severe wind and hail storms ................................. 114
15—Severe wind and hail storms ................................. 128
84