Travelers 2013 Annual Report Download - page 102
Download and view the complete annual report
Please find page 102 of the 2013 Travelers annual report below. You can navigate through the pages in the report by either clicking on the pages listed below, or by using the keyword search tool below to find specific information within the annual report.-
 1
1 -
2
-
3
-
4
-
5
-
6
-
7
-
8
-
9
-
10
-
11
-
12
-
13
-
14
-
15
-
16
-
17
-
18
-
19
-
20
-
21
-
22
-
23
-
24
-
25
-
26
-
27
-
28
-
29
-
30
-
31
-
32
-
33
-
34
-
35
-
36
-
37
-
38
-
39
-
40
-
41
-
42
-
43
-
44
-
45
-
46
-
47
-
48
-
49
-
50
-
51
-
52
-
53
-
54
-
55
-
56
-
57
-
58
-
59
-
60
-
61
-
62
-
63
-
64
-
65
-
66
-
67
-
68
-
69
-
70
-
71
-
72
-
73
-
74
-
75
-
76
-
77
-
78
-
79
-
80
-
81
-
82
-
83
-
84
-
85
-
86
-
87
-
88
-
89
-
90
-
91
-
 92
92 -
 93
93 -
 94
94 -
 95
95 -
 96
96 -
 97
97 -
 98
98 -
 99
99 -
 100
100 -
 101
101 -
 102
102 -
 103
103 -
 104
104 -
 105
105 -
 106
106 -
 107
107 -
 108
108 -
 109
109 -
 110
110 -
 111
111 -
 112
112 -
113
-
114
-
115
-
116
-
117
-
118
-
119
-
120
-
121
-
122
-
123
-
124
-
125
-
126
-
127
-
128
-
129
-
130
-
131
-
132
-
133
-
134
-
135
-
136
-
137
-
138
-
139
-
140
-
141
-
142
-
143
-
144
-
145
-
146
-
147
-
148
-
149
-
150
-
151
-
152
-
153
-
154
-
155
-
156
-
157
-
158
-
159
-
160
-
161
-
162
-
163
-
164
-
165
-
166
-
167
-
168
-
169
-
170
-
171
-
172
-
173
-
174
-
175
-
176
-
177
-
178
-
179
-
180
-
181
-
182
-
183
-
184
-
185
-
186
-
187
-
188
-
189
-
190
-
191
-
192
-
193
-
194
-
195
-
196
-
197
-
198
-
199
-
200
-
201
-
202
-
203
-
204
-
205
-
206
-
207
-
208
-
209
-
210
-
211
-
212
-
213
-
214
-
215
-
216
-
217
-
218
-
219
-
220
-
221
-
222
-
223
-
224
-
225
-
226
-
227
-
228
-
229
-
230
-
231
-
232
-
233
-
234
-
235
-
236
-
237
-
238
-
239
-
240
-
241
-
242
-
243
-
244
-
245
-
246
-
247
-
248
-
249
-
250
-
251
-
252
-
253
-
254
-
255
-
256
-
257
-
258
-
259
-
260
-
261
-
262
-
263
-
264
-
265
-
266
-
267
-
268
-
269
-
270
-
271
-
272
-
273
-
274
-
275
-
276
-
277
-
278
-
279
-
280
-
281
-
282
-
283
-
284
-
285
-
286
-
287
-
288
-
289
-
290
-
291
-
292
-
293
-
294
-
295
-
296
-
297
-
298
-
299
-
300
-
301
-
302
-
303
-
304
 |
 |

lower than in 2011. Renewal premium changes remained positive in 2012 and were higher than in 2011,
primarily due to renewal rate increases. New business premiums in 2012 increased over 2011.
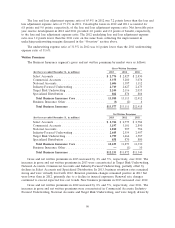
Specialized Distribution. Net written premiums of $858 million in 2013 declined by 1% from 2012,
driven by premium decreases in National Programs. Business retention rates remained strong in 2013
but were lower than in 2012. Renewal premium changes remained positive in 2013 and were slightly
lower than in 2012. New business premiums in 2013 increased over 2012. Net written premiums of
$870 million in 2012 decreased by 1% from 2011. Premium decreases in the Northland business unit
were largely offset by premium growth in the National Programs business unit. Business retention rates
in 2012 remained strong but were lower than in 2011. Renewal premium changes remained positive in
2012 and were higher than in 2011, primarily due to renewal rate increases. New business premiums in
2012 decreased from 2011.
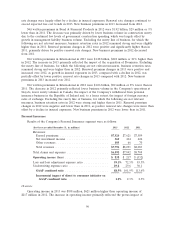
Financial, Professional & International Insurance
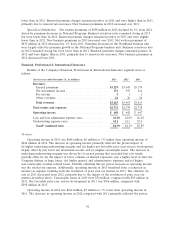
Results of the Company’s Financial, Professional & International Insurance segment were as
follows:
(for the year ended December 31, in millions) 2013 2012 2011
Revenues:
Earned premiums ........................... $3,229 $3,045 $3,174
Net investment income ........................ 372 395 414
Fee income ................................ 211
Other revenues ............................. 22 26 26
Total revenues .............................. $3,625 $3,467 $3,615
Total claims and expenses ....................... $2,732 $2,570 $2,738
Operating income ............................. $ 648 $ 642 $ 647
Loss and loss adjustment expense ratio .............. 43.2% 42.8% 46.4%
Underwriting expense ratio ...................... 41.1 41.3 39.4
GAAP combined ratio ........................ 84.3% 84.1% 85.8%
Overview
Operating income in 2013 was $648 million, $6 million or 1% higher than operating income of
$642 million in 2012. The increase in operating income primarily reflected the pretax impact of
(i) higher underlying underwriting margins and (ii) higher net favorable prior year reserve development,
largely offset by (iii) lower net investment income and (iv) higher catastrophe losses. The increase in
underlying underwriting margins was driven by (i) earned pricing that exceeded loss cost trends,
partially offset by (ii) the impact of lower volumes of insured exposures, (iii) a higher level of what the
Company defines as large losses, (iv) higher general and administrative expenses and (v) higher
non-catastrophe weather-related losses. Partially offsetting this net pretax increase in operating income
was the related tax expense. Additionally, operating income in 2013 benefited from a reduction in
income tax expense resulting from the resolution of prior year tax matters in 2013. The effective tax
rate in 2013 decreased from 2012, primarily due to the impact of the resolution of prior year tax
matters described above. Catastrophe losses in 2013 were $56 million, compared with $50 million in
2012. Net favorable prior year reserve development in 2013 was $306 million, compared with
$298 million in 2012.
Operating income in 2012 was $642 million, $5 million or 1% lower than operating income in
2011. The decrease in operating income in 2012 compared with 2011 primarily reflected the pretax
92