Travelers 2013 Annual Report Download - page 119
Download and view the complete annual report
Please find page 119 of the 2013 Travelers annual report below. You can navigate through the pages in the report by either clicking on the pages listed below, or by using the keyword search tool below to find specific information within the annual report.-
 1
1 -
2
-
3
-
4
-
5
-
6
-
7
-
8
-
9
-
10
-
11
-
12
-
13
-
14
-
15
-
16
-
17
-
18
-
19
-
20
-
21
-
22
-
23
-
24
-
25
-
26
-
27
-
28
-
29
-
30
-
31
-
32
-
33
-
34
-
35
-
36
-
37
-
38
-
39
-
40
-
41
-
42
-
43
-
44
-
45
-
46
-
47
-
48
-
49
-
50
-
51
-
52
-
53
-
54
-
55
-
56
-
57
-
58
-
59
-
60
-
61
-
62
-
63
-
64
-
65
-
66
-
67
-
68
-
69
-
70
-
71
-
72
-
73
-
74
-
75
-
76
-
77
-
78
-
79
-
80
-
81
-
82
-
83
-
84
-
85
-
86
-
87
-
88
-
89
-
90
-
91
-
92
-
93
-
94
-
95
-
96
-
97
-
98
-
99
-
100
-
101
-
102
-
103
-
104
-
105
-
106
-
107
-
108
-
 109
109 -
 110
110 -
 111
111 -
 112
112 -
 113
113 -
 114
114 -
 115
115 -
 116
116 -
 117
117 -
 118
118 -
 119
119 -
 120
120 -
 121
121 -
 122
122 -
 123
123 -
 124
124 -
 125
125 -
 126
126 -
 127
127 -
 128
128 -
 129
129 -
130
-
131
-
132
-
133
-
134
-
135
-
136
-
137
-
138
-
139
-
140
-
141
-
142
-
143
-
144
-
145
-
146
-
147
-
148
-
149
-
150
-
151
-
152
-
153
-
154
-
155
-
156
-
157
-
158
-
159
-
160
-
161
-
162
-
163
-
164
-
165
-
166
-
167
-
168
-
169
-
170
-
171
-
172
-
173
-
174
-
175
-
176
-
177
-
178
-
179
-
180
-
181
-
182
-
183
-
184
-
185
-
186
-
187
-
188
-
189
-
190
-
191
-
192
-
193
-
194
-
195
-
196
-
197
-
198
-
199
-
200
-
201
-
202
-
203
-
204
-
205
-
206
-
207
-
208
-
209
-
210
-
211
-
212
-
213
-
214
-
215
-
216
-
217
-
218
-
219
-
220
-
221
-
222
-
223
-
224
-
225
-
226
-
227
-
228
-
229
-
230
-
231
-
232
-
233
-
234
-
235
-
236
-
237
-
238
-
239
-
240
-
241
-
242
-
243
-
244
-
245
-
246
-
247
-
248
-
249
-
250
-
251
-
252
-
253
-
254
-
255
-
256
-
257
-
258
-
259
-
260
-
261
-
262
-
263
-
264
-
265
-
266
-
267
-
268
-
269
-
270
-
271
-
272
-
273
-
274
-
275
-
276
-
277
-
278
-
279
-
280
-
281
-
282
-
283
-
284
-
285
-
286
-
287
-
288
-
289
-
290
-
291
-
292
-
293
-
294
-
295
-
296
-
297
-
298
-
299
-
300
-
301
-
302
-
303
-
304
 |
 |

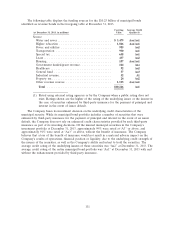
(2) As a result of the acquisition of Dominion, total investments in Canadian municipal securities
increased by $473 million at November 1, 2013.
(3) Sovereign corporate securities include corporate securities that are backed by a government and
include sovereign banks and securities issued under the Temporary Liquidity Guaranty and the
Federal Ship Financing Programs.
(4) Included in commercial mortgage-backed securities and project loans at December 31, 2013 and
2012 were $45 million and $50 million of securities guaranteed by the U.S. government,
respectively, and $14 million of securities guaranteed by government sponsored enterprises at both
dates.
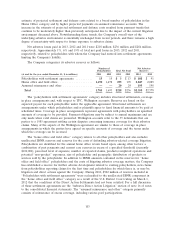
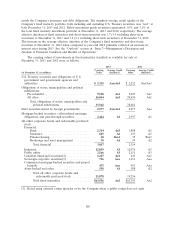
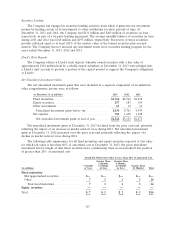
The following table sets forth the Company’s fixed maturity investment portfolio rated using
external ratings agencies or by the Company when a public rating does not exist:
Carrying Percent of Total
(at December 31, 2013, in millions) Value Carrying Value
Quality Rating:
Aaa ....................................... $27,209 42.5%
Aa ........................................ 19,430 30.4
A......................................... 9,331 14.6
Baa ....................................... 6,054 9.5
Total investment grade .......................... 62,024 97.0
Below investment grade ......................... 1,932 3.0
Total fixed maturities ........................... $63,956 100.0%
The amortized cost and fair value of fixed maturities by contractual maturity follow. Actual
maturities will differ from contractual maturities because borrowers may have the right to call or
prepay obligations with or without call or prepayment penalties.
Amortized Fair
(at December 31, 2013, in millions) Cost Value
Due in one year or less .............................. $ 8,386 $ 8,525
Due after 1 year through 2 years ....................... 7,253 7,534
Due after 2 years through 3 years ...................... 5,152 5,458
Due after 3 years through 4 years ...................... 4,200 4,442
Due after 4 years through 5 years ...................... 3,754 3,973
Due after 5 years through 10 years ...................... 17,225 17,579
Due after 10 years .................................. 13,963 14,021
59,933 61,532
Mortgage-backed securities, collateralized mortgage obligations
and pass-through securities .......................... 2,263 2,424
Total .......................................... $62,196 $63,956
Obligations of States, Municipalities and Political Subdivisions
The Company’s fixed maturity investment portfolio at December 31, 2013 and 2012 included
$35.56 billion and $38.68 billion, respectively, of securities which are obligations of states, municipalities
and political subdivisions (collectively referred to as the municipal bond portfolio). The municipal bond
portfolio is diversified across the United States, the District of Columbia and Puerto Rico and includes
general obligation and revenue bonds issued by states, cities, counties, school districts and similar
issuers. Included in the municipal bond portfolio at December 31, 2013 and 2012 were $9.52 billion and
109