Travelers 2013 Annual Report Download - page 37
Download and view the complete annual report
Please find page 37 of the 2013 Travelers annual report below. You can navigate through the pages in the report by either clicking on the pages listed below, or by using the keyword search tool below to find specific information within the annual report.-
 1
1 -
2
-
3
-
4
-
5
-
6
-
7
-
8
-
9
-
10
-
11
-
12
-
13
-
14
-
15
-
16
-
17
-
18
-
19
-
20
-
21
-
22
-
23
-
24
-
25
-
26
-
 27
27 -
 28
28 -
 29
29 -
 30
30 -
 31
31 -
 32
32 -
 33
33 -
 34
34 -
 35
35 -
 36
36 -
 37
37 -
 38
38 -
 39
39 -
 40
40 -
 41
41 -
 42
42 -
 43
43 -
 44
44 -
 45
45 -
 46
46 -
 47
47 -
48
-
49
-
50
-
51
-
52
-
53
-
54
-
55
-
56
-
57
-
58
-
59
-
60
-
61
-
62
-
63
-
64
-
65
-
66
-
67
-
68
-
69
-
70
-
71
-
72
-
73
-
74
-
75
-
76
-
77
-
78
-
79
-
80
-
81
-
82
-
83
-
84
-
85
-
86
-
87
-
88
-
89
-
90
-
91
-
92
-
93
-
94
-
95
-
96
-
97
-
98
-
99
-
100
-
101
-
102
-
103
-
104
-
105
-
106
-
107
-
108
-
109
-
110
-
111
-
112
-
113
-
114
-
115
-
116
-
117
-
118
-
119
-
120
-
121
-
122
-
123
-
124
-
125
-
126
-
127
-
128
-
129
-
130
-
131
-
132
-
133
-
134
-
135
-
136
-
137
-
138
-
139
-
140
-
141
-
142
-
143
-
144
-
145
-
146
-
147
-
148
-
149
-
150
-
151
-
152
-
153
-
154
-
155
-
156
-
157
-
158
-
159
-
160
-
161
-
162
-
163
-
164
-
165
-
166
-
167
-
168
-
169
-
170
-
171
-
172
-
173
-
174
-
175
-
176
-
177
-
178
-
179
-
180
-
181
-
182
-
183
-
184
-
185
-
186
-
187
-
188
-
189
-
190
-
191
-
192
-
193
-
194
-
195
-
196
-
197
-
198
-
199
-
200
-
201
-
202
-
203
-
204
-
205
-
206
-
207
-
208
-
209
-
210
-
211
-
212
-
213
-
214
-
215
-
216
-
217
-
218
-
219
-
220
-
221
-
222
-
223
-
224
-
225
-
226
-
227
-
228
-
229
-
230
-
231
-
232
-
233
-
234
-
235
-
236
-
237
-
238
-
239
-
240
-
241
-
242
-
243
-
244
-
245
-
246
-
247
-
248
-
249
-
250
-
251
-
252
-
253
-
254
-
255
-
256
-
257
-
258
-
259
-
260
-
261
-
262
-
263
-
264
-
265
-
266
-
267
-
268
-
269
-
270
-
271
-
272
-
273
-
274
-
275
-
276
-
277
-
278
-
279
-
280
-
281
-
282
-
283
-
284
-
285
-
286
-
287
-
288
-
289
-
290
-
291
-
292
-
293
-
294
-
295
-
296
-
297
-
298
-
299
-
300
-
301
-
302
-
303
-
304
 |
 |

Because of these and other factors, it is difficult to develop a meaningful extrapolation of
estimated future redundancies or deficiencies in loss reserves from the data in the table.
(at December 31, in millions) 2003 2004 2005 2006 2007 2008 2009 2010 2011 2012 2013
Reserves for claims and claim
adjustment expense originally
estimated ............... $24,055 $41,446 $42,895 $42,844 $43,098 $41,312 $40,941 $40,255 $40,919 $40,634 $41,585
Cumulative amounts paid as of
One year later ............ 4,651 8,871 8,632 7,417 8,146 7,519 7,748 7,653 8,326 8,416
Two years later ............ 8,686 14,666 13,837 13,181 12,798 12,454 12,374 12,567 13,447
Three years later .......... 11,541 18,733 18,466 16,545 16,264 15,668 15,708 16,081
Four years later ........... 13,708 22,514 21,025 19,113 18,524 18,053 18,126
Five years later ........... 15,574 24,572 22,992 20,820 20,244 19,824
Six years later ............ 16,624 26,189 24,423 22,205 21,609
Seven years later .......... 17,558 27,469 25,616 23,381
Eight years later ........... 18,320 28,557 26,675
Nine years later ........... 18,988 29,543
Ten years later ............ 19,602
Reserves re-estimated as of
One year later ............ 24,222 41,706 42,466 42,172 41,373 39,863 39,524 39,413 39,845 39,690
Two years later ............ 25,272 42,565 42,311 40,837 39,925 38,640 38,421 38,393 38,964
Three years later .......... 26,042 42,940 41,692 39,739 38,842 37,613 37,539 37,576
Four years later ........... 26,501 43,148 40,855 38,734 38,223 36,892 36,889
Five years later ........... 26,803 42,655 40,026 38,409 37,716 36,361
Six years later ............ 26,619 42,068 39,849 38,134 37,323
Seven years later .......... 26,342 42,019 39,694 37,858
Eight years later ........... 26,382 41,987 39,518
Nine years later ........... 26,431 41,942
Ten years later ............ 26,455
Cumulative deficiency (redundancy) 2,400 496 (3,377) (4,986) (5,775) (4,951) (4,052) (2,679) (1,955) (944)
Gross liability—end of year ..... $34,760 $59,438 $61,461 $59,677 $58,094 $55,121 $53,529 $51,537 $51,353 $50,888 $50,865
Reinsurance recoverables ....... 10,705 17,992 18,566 16,833 14,996 13,809 12,588 11,282 10,434 10,254 9,280
Net liability—end of year ....... $24,055 $41,446 $42,895 $42,844 $43,098 $41,312 $40,941 $40,255 $40,919 $40,634 $41,585
Gross re-estimated liability-latest . . $37,517 $59,672 $57,336 $53,229 $50,927 $48,579 $48,055 $47,892 $48,787 $50,071
Re-estimated reinsurance
recoverables-latest .......... 11,062 17,730 17,818 15,371 13,604 12,218 11,166 10,316 9,823 10,381
Net re-estimated liability-latest . . . $26,455 $41,942 $39,518 $37,858 $37,323 $36,361 $36,889 $37,576 $38,964 $39,690
Gross cumulative deficiency
(redundancy) ............. $2,757 $ 234 $ (4,125) $(6,448) $ (7,167) $(6,542) $(5,474) $ (3,645) $(2,566) $ (817)
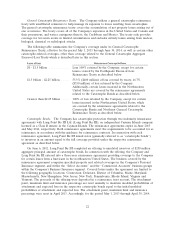
For the year 2003, the table excludes reserves of SPC, which were acquired in the Merger on April 1,
2004. Accordingly, the reserve development (net reserves for claims and claim adjustment expense
re-estimated as of subsequent years less net reserves recorded at the end of the year, as originally estimated)
for 2003 relates only to losses recorded by TPC and does not include reserve development recorded by SPC.
For 2004 and subsequent years, the table includes SPC reserves acquired and subsequent development
recorded on those reserves. At December 31, 2004, SPC gross reserves were $23,274 million, and net
reserves were $15,959 million. For years prior to 2013, the table excludes reserves of Dominion, which were
acquired by the Company on November 1, 2013. Accordingly, the reserve development for years prior to
2013 does not include reserve development recorded by Dominion. At December 31, 2013, Dominion’s gross
reserves were $2,110 million, and net reserves were $1,779 million.
In December 2008, the Company completed the sale of Unionamerica Holdings Limited
(Unionamerica), which comprised its United Kingdom (U.K.)-based runoff insurance and reinsurance
businesses. (Unionamerica was acquired in 2004 as part of the Merger.) Immediately before the sale, the
claims and claim adjustment expense reserves of Unionamerica totaled $790 million. As a result of the sale,
those obligations ceased being the responsibility of the Company and its affiliates. The sale is reflected in the
table as a reduction in December 31, 2008 net reserves of $790 million and as a $790 million increase in paid
losses for each of the years 2004 through 2007 to reflect the transfer (payment) of the reserves to the buyer,
resulting in no impact to incurred losses.
27