Travelers 2013 Annual Report Download - page 246
Download and view the complete annual report
Please find page 246 of the 2013 Travelers annual report below. You can navigate through the pages in the report by either clicking on the pages listed below, or by using the keyword search tool below to find specific information within the annual report.-
 1
1 -
2
-
3
-
4
-
5
-
6
-
7
-
8
-
9
-
10
-
11
-
12
-
13
-
14
-
15
-
16
-
17
-
18
-
19
-
20
-
21
-
22
-
23
-
24
-
25
-
26
-
27
-
28
-
29
-
30
-
31
-
32
-
33
-
34
-
35
-
36
-
37
-
38
-
39
-
40
-
41
-
42
-
43
-
44
-
45
-
46
-
47
-
48
-
49
-
50
-
51
-
52
-
53
-
54
-
55
-
56
-
57
-
58
-
59
-
60
-
61
-
62
-
63
-
64
-
65
-
66
-
67
-
68
-
69
-
70
-
71
-
72
-
73
-
74
-
75
-
76
-
77
-
78
-
79
-
80
-
81
-
82
-
83
-
84
-
85
-
86
-
87
-
88
-
89
-
90
-
91
-
92
-
93
-
94
-
95
-
96
-
97
-
98
-
99
-
100
-
101
-
102
-
103
-
104
-
105
-
106
-
107
-
108
-
109
-
110
-
111
-
112
-
113
-
114
-
115
-
116
-
117
-
118
-
119
-
120
-
121
-
122
-
123
-
124
-
125
-
126
-
127
-
128
-
129
-
130
-
131
-
132
-
133
-
134
-
135
-
136
-
137
-
138
-
139
-
140
-
141
-
142
-
143
-
144
-
145
-
146
-
147
-
148
-
149
-
150
-
151
-
152
-
153
-
154
-
155
-
156
-
157
-
158
-
159
-
160
-
161
-
162
-
163
-
164
-
165
-
166
-
167
-
168
-
169
-
170
-
171
-
172
-
173
-
174
-
175
-
176
-
177
-
178
-
179
-
180
-
181
-
182
-
183
-
184
-
185
-
186
-
187
-
188
-
189
-
190
-
191
-
192
-
193
-
194
-
195
-
196
-
197
-
198
-
199
-
200
-
201
-
202
-
203
-
204
-
205
-
206
-
207
-
208
-
209
-
210
-
211
-
212
-
213
-
214
-
215
-
216
-
217
-
218
-
219
-
220
-
221
-
222
-
223
-
224
-
225
-
226
-
227
-
228
-
229
-
230
-
231
-
232
-
233
-
234
-
235
-
 236
236 -
 237
237 -
 238
238 -
 239
239 -
 240
240 -
 241
241 -
 242
242 -
 243
243 -
 244
244 -
 245
245 -
 246
246 -
 247
247 -
 248
248 -
 249
249 -
 250
250 -
 251
251 -
 252
252 -
 253
253 -
 254
254 -
 255
255 -
 256
256 -
257
-
258
-
259
-
260
-
261
-
262
-
263
-
264
-
265
-
266
-
267
-
268
-
269
-
270
-
271
-
272
-
273
-
274
-
275
-
276
-
277
-
278
-
279
-
280
-
281
-
282
-
283
-
284
-
285
-
286
-
287
-
288
-
289
-
290
-
291
-
292
-
293
-
294
-
295
-
296
-
297
-
298
-
299
-
300
-
301
-
302
-
303
-
304
 |
 |

THE TRAVELERS COMPANIES, INC. AND SUBSIDIARIES
NOTES TO CONSOLIDATED FINANCIAL STATEMENTS (Continued)
14. PENSION PLANS, RETIREMENT BENEFITS AND SAVINGS PLANS (Continued)
December 31, 2013 and 2012, respectively. The fair value of plan assets for the above plans was
$33 million and $2.85 billion at December 31, 2013 and 2012, respectively.
The Company has discretion regarding whether to provide additional funding and when to provide
such funding to its qualified domestic pension plan. In 2013, there were no required contributions to
the qualified domestic pension plan, and the Company made no voluntary contributions to the qualified
domestic pension plan. In 2012 and 2011, the Company voluntarily made contributions totaling
$217 million and $185 million, respectively, to the qualified domestic pension plan. The Company has
not determined whether or not additional funding will be made during 2014. There is no required
contribution to the qualified domestic pension plan during 2014. With respect to the Company’s foreign
pension plans, there are no significant required contributions in 2014.
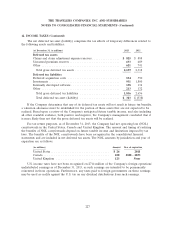
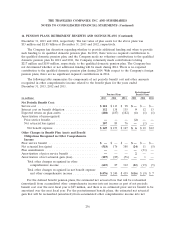
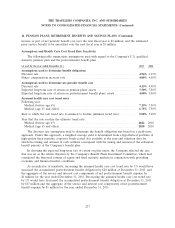
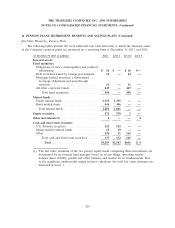
The following table summarizes the components of net periodic benefit cost and other amounts
recognized in other comprehensive income related to the benefit plans for the years ended
December 31, 2013, 2012 and 2011.
Postretirement
Pension Plans Benefit Plans
(in millions) 2013 2012 2011 2013 2012 2011
Net Periodic Benefit Cost:
Service cost .................................. $ 118 $ 113 $ 98 $— $— $—
Interest cost on benefit obligation .................. 132 138 135 912 13
Expected return on plan assets .................... (208) (187) (182) (1) (1) (1)
Amortization of unrecognized:
Prior service benefit ........................... ———(2) ——
Net actuarial loss (gain) ........................ 107 89 76 —(1) —
Net benefit expense ......................... $ 149 $ 153 $ 127 $6 $ 10 $12
Other Changes in Benefit Plan Assets and Benefit
Obligations Recognized in Other Comprehensive
Income:
Prior service benefit ............................ $— $— $— $— $— $—
Net actuarial loss (gain) ......................... (518) 176 388 (24) 11 (5)
Plan amendments .............................. ————(31) —
Amortization of prior service benefit ................ ———2——
Amortization of net actuarial gain (loss) .............. (107) (89) (76) —1—
Total other changes recognized in other
comprehensive income ..................... (625) 87 312 (22) (19) (5)
Total other changes recognized in net benefit expense
and other comprehensive income .............. $(476) $ 240 $ 439 $(16) $(9) $7
For the defined benefit pension plans, the estimated net actuarial loss that will be reclassified
(amortized) from accumulated other comprehensive income into net income as part of net periodic
benefit cost over the next fiscal year is $65 million, and there is no estimated prior service benefit to be
amortized over the next fiscal year. For the postretirement benefit plans, the estimated net actuarial
gain that will be reclassified (amortized) from accumulated other comprehensive income into net
236