Travelers 2013 Annual Report Download - page 100
Download and view the complete annual report
Please find page 100 of the 2013 Travelers annual report below. You can navigate through the pages in the report by either clicking on the pages listed below, or by using the keyword search tool below to find specific information within the annual report.-
 1
1 -
2
-
3
-
4
-
5
-
6
-
7
-
8
-
9
-
10
-
11
-
12
-
13
-
14
-
15
-
16
-
17
-
18
-
19
-
20
-
21
-
22
-
23
-
24
-
25
-
26
-
27
-
28
-
29
-
30
-
31
-
32
-
33
-
34
-
35
-
36
-
37
-
38
-
39
-
40
-
41
-
42
-
43
-
44
-
45
-
46
-
47
-
48
-
49
-
50
-
51
-
52
-
53
-
54
-
55
-
56
-
57
-
58
-
59
-
60
-
61
-
62
-
63
-
64
-
65
-
66
-
67
-
68
-
69
-
70
-
71
-
72
-
73
-
74
-
75
-
76
-
77
-
78
-
79
-
80
-
81
-
82
-
83
-
84
-
85
-
86
-
87
-
88
-
89
-
 90
90 -
 91
91 -
 92
92 -
 93
93 -
 94
94 -
 95
95 -
 96
96 -
 97
97 -
 98
98 -
 99
99 -
 100
100 -
 101
101 -
 102
102 -
 103
103 -
 104
104 -
 105
105 -
 106
106 -
 107
107 -
 108
108 -
 109
109 -
 110
110 -
111
-
112
-
113
-
114
-
115
-
116
-
117
-
118
-
119
-
120
-
121
-
122
-
123
-
124
-
125
-
126
-
127
-
128
-
129
-
130
-
131
-
132
-
133
-
134
-
135
-
136
-
137
-
138
-
139
-
140
-
141
-
142
-
143
-
144
-
145
-
146
-
147
-
148
-
149
-
150
-
151
-
152
-
153
-
154
-
155
-
156
-
157
-
158
-
159
-
160
-
161
-
162
-
163
-
164
-
165
-
166
-
167
-
168
-
169
-
170
-
171
-
172
-
173
-
174
-
175
-
176
-
177
-
178
-
179
-
180
-
181
-
182
-
183
-
184
-
185
-
186
-
187
-
188
-
189
-
190
-
191
-
192
-
193
-
194
-
195
-
196
-
197
-
198
-
199
-
200
-
201
-
202
-
203
-
204
-
205
-
206
-
207
-
208
-
209
-
210
-
211
-
212
-
213
-
214
-
215
-
216
-
217
-
218
-
219
-
220
-
221
-
222
-
223
-
224
-
225
-
226
-
227
-
228
-
229
-
230
-
231
-
232
-
233
-
234
-
235
-
236
-
237
-
238
-
239
-
240
-
241
-
242
-
243
-
244
-
245
-
246
-
247
-
248
-
249
-
250
-
251
-
252
-
253
-
254
-
255
-
256
-
257
-
258
-
259
-
260
-
261
-
262
-
263
-
264
-
265
-
266
-
267
-
268
-
269
-
270
-
271
-
272
-
273
-
274
-
275
-
276
-
277
-
278
-
279
-
280
-
281
-
282
-
283
-
284
-
285
-
286
-
287
-
288
-
289
-
290
-
291
-
292
-
293
-
294
-
295
-
296
-
297
-
298
-
299
-
300
-
301
-
302
-
303
-
304
 |
 |

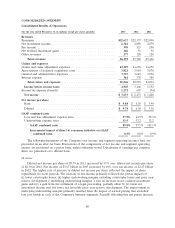
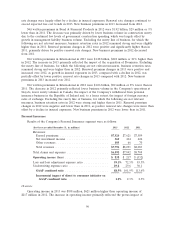
The loss and loss adjustment expense ratio of 65.9% in 2012 was 7.2 points lower than the loss and
loss adjustment expense ratio of 73.1% in 2011. Catastrophe losses in 2012 and 2011 accounted for
6.8 points and 9.0 points, respectively, of the loss and loss adjustment expense ratio. Net favorable prior
year reserve development in 2012 and 2011 provided 4.0 points and 2.2 points of benefit, respectively,
to the loss and loss adjustment expense ratio. The 2012 underlying loss and loss adjustment expense
ratio was 3.2 points lower than the 2011 ratio on the same basis, reflecting the improvement in
underlying underwriting margins discussed in the ‘‘Overview’’ section above.
The underwriting expense ratio of 31.5% in 2012 was 0.1 points lower than the 2011 underwriting
expense ratio of 31.6%.
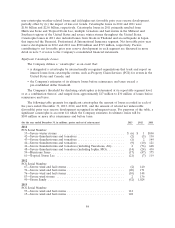
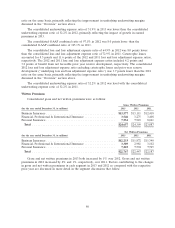
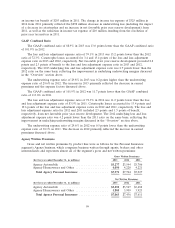
Written Premiums
The Business Insurance segment’s gross and net written premiums by market were as follows:
Gross Written Premiums
(for the year ended December 31, in millions) 2013 2012 2011
Select Accounts ............................. $ 2,774 $ 2,827 $ 2,830
Commercial Accounts ........................ 3,375 3,280 3,076
National Accounts ........................... 1,606 1,387 1,112
Industry-Focused Underwriting .................. 2,719 2,627 2,473
Target Risk Underwriting ...................... 2,244 2,116 2,035
Specialized Distribution ....................... 862 876 886
Total Business Insurance Core ................ 13,580 13,113 12,412
Business Insurance Other ...................... (3) (2) 6
Total Business Insurance .................... $13,577 $13,111 $12,418
Net Written Premiums
(for the year ended December 31, in millions) 2013 2012 2011
Select Accounts ............................. $ 2,724 $ 2,775 $ 2,784
Commercial Accounts ........................ 3,197 3,101 2,890
National Accounts ........................... 1,010 907 782
Industry-Focused Underwriting .................. 2,645 2,554 2,407
Target Risk Underwriting ...................... 1,799 1,666 1,587
Specialized Distribution ....................... 858 870 880
Total Business Insurance Core ................ 12,233 11,873 11,330
Business Insurance Other ...................... —(1) 10
Total Business Insurance .................... $12,233 $11,872 $11,340
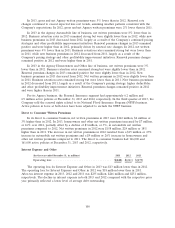
Gross and net written premiums in 2013 increased by 4% and 3%, respectively, over 2012. The
increases in gross and net written premiums in 2013 were concentrated in Target Risk Underwriting,
National Accounts, Commercial Accounts and Industry-Focused Underwriting, partially offset by
declines in Select Accounts and Specialized Distribution. In 2013, business retention rates remained
strong and were virtually level with 2012. Renewal premium changes remained positive in 2013 but
were lower than in 2012, primarily due to a decline in insured exposures. Renewal rate changes
continued to exceed expected loss cost trends. New business premiums in 2013 increased over 2012.
Gross and net written premiums in 2012 increased by 6% and 5%, respectively, over 2011. The
increases in gross and net written premiums were concentrated in Commercial Accounts, Industry-
Focused Underwriting, National Accounts and Target Risk Underwriting, and were largely driven by
90