Travelers 2013 Annual Report Download - page 109
Download and view the complete annual report
Please find page 109 of the 2013 Travelers annual report below. You can navigate through the pages in the report by either clicking on the pages listed below, or by using the keyword search tool below to find specific information within the annual report.-
 1
1 -
2
-
3
-
4
-
5
-
6
-
7
-
8
-
9
-
10
-
11
-
12
-
13
-
14
-
15
-
16
-
17
-
18
-
19
-
20
-
21
-
22
-
23
-
24
-
25
-
26
-
27
-
28
-
29
-
30
-
31
-
32
-
33
-
34
-
35
-
36
-
37
-
38
-
39
-
40
-
41
-
42
-
43
-
44
-
45
-
46
-
47
-
48
-
49
-
50
-
51
-
52
-
53
-
54
-
55
-
56
-
57
-
58
-
59
-
60
-
61
-
62
-
63
-
64
-
65
-
66
-
67
-
68
-
69
-
70
-
71
-
72
-
73
-
74
-
75
-
76
-
77
-
78
-
79
-
80
-
81
-
82
-
83
-
84
-
85
-
86
-
87
-
88
-
89
-
90
-
91
-
92
-
93
-
94
-
95
-
96
-
97
-
98
-
 99
99 -
 100
100 -
 101
101 -
 102
102 -
 103
103 -
 104
104 -
 105
105 -
 106
106 -
 107
107 -
 108
108 -
 109
109 -
 110
110 -
 111
111 -
 112
112 -
 113
113 -
 114
114 -
 115
115 -
 116
116 -
 117
117 -
 118
118 -
 119
119 -
120
-
121
-
122
-
123
-
124
-
125
-
126
-
127
-
128
-
129
-
130
-
131
-
132
-
133
-
134
-
135
-
136
-
137
-
138
-
139
-
140
-
141
-
142
-
143
-
144
-
145
-
146
-
147
-
148
-
149
-
150
-
151
-
152
-
153
-
154
-
155
-
156
-
157
-
158
-
159
-
160
-
161
-
162
-
163
-
164
-
165
-
166
-
167
-
168
-
169
-
170
-
171
-
172
-
173
-
174
-
175
-
176
-
177
-
178
-
179
-
180
-
181
-
182
-
183
-
184
-
185
-
186
-
187
-
188
-
189
-
190
-
191
-
192
-
193
-
194
-
195
-
196
-
197
-
198
-
199
-
200
-
201
-
202
-
203
-
204
-
205
-
206
-
207
-
208
-
209
-
210
-
211
-
212
-
213
-
214
-
215
-
216
-
217
-
218
-
219
-
220
-
221
-
222
-
223
-
224
-
225
-
226
-
227
-
228
-
229
-
230
-
231
-
232
-
233
-
234
-
235
-
236
-
237
-
238
-
239
-
240
-
241
-
242
-
243
-
244
-
245
-
246
-
247
-
248
-
249
-
250
-
251
-
252
-
253
-
254
-
255
-
256
-
257
-
258
-
259
-
260
-
261
-
262
-
263
-
264
-
265
-
266
-
267
-
268
-
269
-
270
-
271
-
272
-
273
-
274
-
275
-
276
-
277
-
278
-
279
-
280
-
281
-
282
-
283
-
284
-
285
-
286
-
287
-
288
-
289
-
290
-
291
-
292
-
293
-
294
-
295
-
296
-
297
-
298
-
299
-
300
-
301
-
302
-
303
-
304
 |
 |

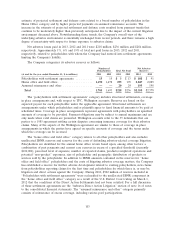
an income tax benefit of $293 million in 2011. The change in income tax expense of $325 million in
2012 from 2011 primarily reflected the $898 million decrease in underwriting loss (including the impact
of a decrease in catastrophes and an increase in net favorable prior year reserve development) from
2011, as well as the reduction in income tax expense of $10 million resulting from the resolution of
prior year tax matters in 2011.
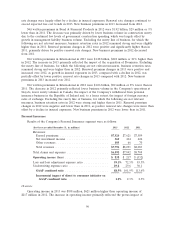
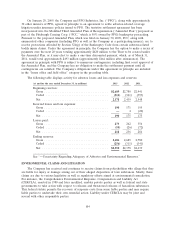
GAAP Combined Ratio
The GAAP combined ratio of 88.9% in 2013 was 13.0 points lower than the GAAP combined ratio
of 101.9% in 2012.
The loss and loss adjustment expense ratio of 59.1% in 2013 was 13.2 points lower than the 2012
ratio of 72.3%. Catastrophe losses accounted for 3.4 and 13.4 points of the loss and loss adjustment
expense ratio in 2013 and 2012, respectively. Net favorable prior year reserve development provided 2.8
points and 2.3 points of benefit to the loss and loss adjustment expense ratio in 2013 and 2012,
respectively. The 2013 underlying loss and loss adjustment expense ratio was 2.7 points lower than the
2012 ratio on the same basis, reflecting the improvement in underlying underwriting margins discussed
in the ‘‘Overview’’ section above.
The underwriting expense ratio of 29.8% in 2013 was 0.2 points higher than the underwriting
expense ratio of 29.6% in 2012. The increase in 2013 primarily reflected the decrease in earned
premiums and the expense factors discussed above.
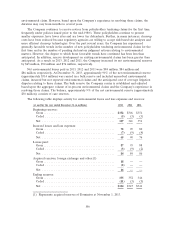
The GAAP combined ratio of 101.9% in 2012 was 11.7 points lower than the GAAP combined
ratio of 113.6% in 2011.
The loss and loss adjustment expense ratio of 72.3% in 2012 was 11.2 points lower than the loss
and loss adjustment expense ratio of 83.5% in 2011. Catastrophe losses accounted for 13.4 points and
19.6 points of the loss and loss adjustment expense ratios in 2012 and 2011, respectively. The loss and
loss adjustment expense ratio for 2012 and 2011 included 2.3 points and 1.5 points of benefit,
respectively, from net favorable prior year reserve development. The 2012 underlying loss and loss
adjustment expense ratio was 4.2 points lower than the 2011 ratio on the same basis, reflecting the
improvement in underlying underwriting margins discussed in the ‘‘Overview’’ section above.
The underwriting expense ratio of 29.6% in 2012 was 0.5 points lower than the underwriting
expense ratio of 30.1% in 2011. The decrease in 2012 primarily reflected the increase in earned
premiums discussed above.
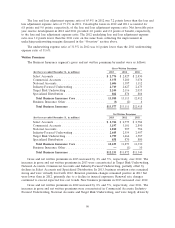
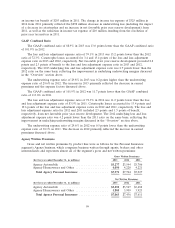
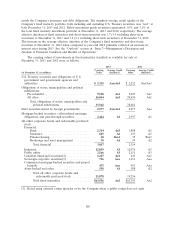
Agency Written Premiums
Gross and net written premiums by product line were as follows for the Personal Insurance
segment’s Agency business, which comprises business written through agents, brokers and other
intermediaries and represents almost all of the segment’s gross and net written premiums:
Gross Written Premiums
(for the year ended December 31, in millions) 2013 2012 2011
Agency Automobile ............................ $3,277 $3,544 $3,706
Agency Homeowners and Other ................... 4,094 4,220 4,221
Total Agency Personal Insurance ................. $7,371 $7,764 $7,927
Net Written Premiums
(for the year ended December 31, in millions) 2013 2012 2011
Agency Automobile ............................ $3,258 $3,527 $3,688
Agency Homeowners and Other ................... 3,805 3,909 3,923
Total Agency Personal Insurance ................. $7,063 $7,436 $7,611
99