Travelers 2013 Annual Report Download - page 126
Download and view the complete annual report
Please find page 126 of the 2013 Travelers annual report below. You can navigate through the pages in the report by either clicking on the pages listed below, or by using the keyword search tool below to find specific information within the annual report.-
 1
1 -
2
-
3
-
4
-
5
-
6
-
7
-
8
-
9
-
10
-
11
-
12
-
13
-
14
-
15
-
16
-
17
-
18
-
19
-
20
-
21
-
22
-
23
-
24
-
25
-
26
-
27
-
28
-
29
-
30
-
31
-
32
-
33
-
34
-
35
-
36
-
37
-
38
-
39
-
40
-
41
-
42
-
43
-
44
-
45
-
46
-
47
-
48
-
49
-
50
-
51
-
52
-
53
-
54
-
55
-
56
-
57
-
58
-
59
-
60
-
61
-
62
-
63
-
64
-
65
-
66
-
67
-
68
-
69
-
70
-
71
-
72
-
73
-
74
-
75
-
76
-
77
-
78
-
79
-
80
-
81
-
82
-
83
-
84
-
85
-
86
-
87
-
88
-
89
-
90
-
91
-
92
-
93
-
94
-
95
-
96
-
97
-
98
-
99
-
100
-
101
-
102
-
103
-
104
-
105
-
106
-
107
-
108
-
109
-
110
-
111
-
112
-
113
-
114
-
115
-
 116
116 -
 117
117 -
 118
118 -
 119
119 -
 120
120 -
 121
121 -
 122
122 -
 123
123 -
 124
124 -
 125
125 -
 126
126 -
 127
127 -
 128
128 -
 129
129 -
 130
130 -
 131
131 -
 132
132 -
 133
133 -
 134
134 -
 135
135 -
 136
136 -
137
-
138
-
139
-
140
-
141
-
142
-
143
-
144
-
145
-
146
-
147
-
148
-
149
-
150
-
151
-
152
-
153
-
154
-
155
-
156
-
157
-
158
-
159
-
160
-
161
-
162
-
163
-
164
-
165
-
166
-
167
-
168
-
169
-
170
-
171
-
172
-
173
-
174
-
175
-
176
-
177
-
178
-
179
-
180
-
181
-
182
-
183
-
184
-
185
-
186
-
187
-
188
-
189
-
190
-
191
-
192
-
193
-
194
-
195
-
196
-
197
-
198
-
199
-
200
-
201
-
202
-
203
-
204
-
205
-
206
-
207
-
208
-
209
-
210
-
211
-
212
-
213
-
214
-
215
-
216
-
217
-
218
-
219
-
220
-
221
-
222
-
223
-
224
-
225
-
226
-
227
-
228
-
229
-
230
-
231
-
232
-
233
-
234
-
235
-
236
-
237
-
238
-
239
-
240
-
241
-
242
-
243
-
244
-
245
-
246
-
247
-
248
-
249
-
250
-
251
-
252
-
253
-
254
-
255
-
256
-
257
-
258
-
259
-
260
-
261
-
262
-
263
-
264
-
265
-
266
-
267
-
268
-
269
-
270
-
271
-
272
-
273
-
274
-
275
-
276
-
277
-
278
-
279
-
280
-
281
-
282
-
283
-
284
-
285
-
286
-
287
-
288
-
289
-
290
-
291
-
292
-
293
-
294
-
295
-
296
-
297
-
298
-
299
-
300
-
301
-
302
-
303
-
304
 |
 |

These unrealized investment losses at December 31, 2013 represent less than 1% of the combined
fixed maturity and equity security portfolios on a pretax basis and less than 1% of shareholders’ equity
on an after-tax basis.
For fixed maturity investments where fair value is less than the carrying value and the Company
did not reach a decision to impair, the Company continues to have the intent and ability to hold such
investments to a projected recovery in value, which may not be until maturity.
At December 31, 2013 and 2012, below investment grade securities comprised 3.0% and 3.1% of
the Company’s fixed maturity investment portfolio, respectively. Included in below investment grade
securities at December 31, 2013 were securities in an unrealized loss position that, in the aggregate,
had an amortized cost of $390 million and a fair value of $373 million, resulting in a net pretax
unrealized investment loss of $17 million. These securities in an unrealized loss position represented
less than 1% of both the total amortized cost and the fair value of the fixed maturity portfolio at
December 31, 2013 and accounted for 2.4% of the total gross pretax unrealized investment loss in the
fixed maturity portfolio at December 31, 2013.
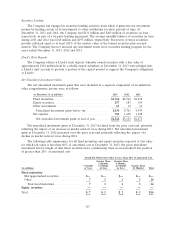
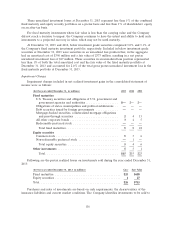
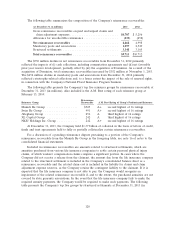
Impairment Charges
Impairment charges included in net realized investment gains in the consolidated statement of
income were as follows:
(for the year ended December 31, in millions) 2013 2012 2011
Fixed maturities
U.S. Treasury securities and obligations of U.S. government and
government agencies and authorities ................... $— $— $—
Obligations of states, municipalities and political subdivisions . . ———
Debt securities issued by foreign governments ............. ———
Mortgage-backed securities, collateralized mortgage obligations
and pass-through securities ......................... 2413
All other corporate bonds ............................ 345
Redeemable preferred stock .......................... ———
Total fixed maturities .............................. 5818
Equity securities
Common stock .................................... 536
Non-redeemable preferred stock ....................... —1—
Total equity securities ............................. 546
Other investments ................................... 531
Total .......................................... $15 $15 $25
Following are the pretax realized losses on investments sold during the year ended December 31,
2013:
(for the year ended December 31, 2013, in millions) Loss Fair Value
Fixed maturities ...................................... $25 $688
Equity securities ...................................... 127
Total .............................................. $26 $715
Purchases and sales of investments are based on cash requirements, the characteristics of the
insurance liabilities and current market conditions. The Company identifies investments to be sold to
116