Travelers 2013 Annual Report Download - page 125
Download and view the complete annual report
Please find page 125 of the 2013 Travelers annual report below. You can navigate through the pages in the report by either clicking on the pages listed below, or by using the keyword search tool below to find specific information within the annual report.-
 1
1 -
2
-
3
-
4
-
5
-
6
-
7
-
8
-
9
-
10
-
11
-
12
-
13
-
14
-
15
-
16
-
17
-
18
-
19
-
20
-
21
-
22
-
23
-
24
-
25
-
26
-
27
-
28
-
29
-
30
-
31
-
32
-
33
-
34
-
35
-
36
-
37
-
38
-
39
-
40
-
41
-
42
-
43
-
44
-
45
-
46
-
47
-
48
-
49
-
50
-
51
-
52
-
53
-
54
-
55
-
56
-
57
-
58
-
59
-
60
-
61
-
62
-
63
-
64
-
65
-
66
-
67
-
68
-
69
-
70
-
71
-
72
-
73
-
74
-
75
-
76
-
77
-
78
-
79
-
80
-
81
-
82
-
83
-
84
-
85
-
86
-
87
-
88
-
89
-
90
-
91
-
92
-
93
-
94
-
95
-
96
-
97
-
98
-
99
-
100
-
101
-
102
-
103
-
104
-
105
-
106
-
107
-
108
-
109
-
110
-
111
-
112
-
113
-
114
-
 115
115 -
 116
116 -
 117
117 -
 118
118 -
 119
119 -
 120
120 -
 121
121 -
 122
122 -
 123
123 -
 124
124 -
 125
125 -
 126
126 -
 127
127 -
 128
128 -
 129
129 -
 130
130 -
 131
131 -
 132
132 -
 133
133 -
 134
134 -
 135
135 -
136
-
137
-
138
-
139
-
140
-
141
-
142
-
143
-
144
-
145
-
146
-
147
-
148
-
149
-
150
-
151
-
152
-
153
-
154
-
155
-
156
-
157
-
158
-
159
-
160
-
161
-
162
-
163
-
164
-
165
-
166
-
167
-
168
-
169
-
170
-
171
-
172
-
173
-
174
-
175
-
176
-
177
-
178
-
179
-
180
-
181
-
182
-
183
-
184
-
185
-
186
-
187
-
188
-
189
-
190
-
191
-
192
-
193
-
194
-
195
-
196
-
197
-
198
-
199
-
200
-
201
-
202
-
203
-
204
-
205
-
206
-
207
-
208
-
209
-
210
-
211
-
212
-
213
-
214
-
215
-
216
-
217
-
218
-
219
-
220
-
221
-
222
-
223
-
224
-
225
-
226
-
227
-
228
-
229
-
230
-
231
-
232
-
233
-
234
-
235
-
236
-
237
-
238
-
239
-
240
-
241
-
242
-
243
-
244
-
245
-
246
-
247
-
248
-
249
-
250
-
251
-
252
-
253
-
254
-
255
-
256
-
257
-
258
-
259
-
260
-
261
-
262
-
263
-
264
-
265
-
266
-
267
-
268
-
269
-
270
-
271
-
272
-
273
-
274
-
275
-
276
-
277
-
278
-
279
-
280
-
281
-
282
-
283
-
284
-
285
-
286
-
287
-
288
-
289
-
290
-
291
-
292
-
293
-
294
-
295
-
296
-
297
-
298
-
299
-
300
-
301
-
302
-
303
-
304
 |
 |

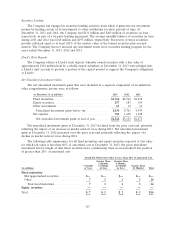
Securities Lending
The Company has engaged in securities lending activities from which it generates net investment
income by lending certain of its investments to other institutions for short periods of time. At
December 31, 2013 and 2012, the Company had $131 million and $403 million of securities on loan,
respectively, as part of a tri-party lending agreement. The average monthly balance of securities on loan
during 2013 and 2012 was $168 million and $197 million, respectively. Borrowers of these securities
provide collateral equal to at least 102% of the market value of the loaned securities plus accrued
interest. The Company has not incurred any investment losses in its securities lending program for the
years ended December 31, 2013, 2012 and 2011.
Lloyd’s Trust Deposit
The Company utilizes a Lloyd’s trust deposit, whereby owned securities with a fair value of
approximately $181 million held by a wholly-owned subsidiary at December 31, 2013 were pledged into
a Lloyd’s trust account to provide a portion of the capital needed to support the Company’s obligations
at Lloyd’s.
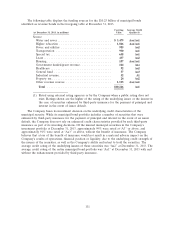
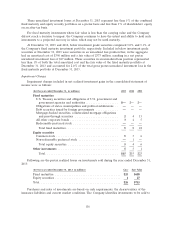
Net Unrealized Investment Gains
The net unrealized investment gains that were included as a separate component of accumulated
other comprehensive income were as follows:
(at December 31, in millions) 2013 2012 2011
Fixed maturities ............................... $1,760 $4,564 $4,238
Equity securities ............................... 257 183 145
Other investments ............................. 13 14 16
Unrealized investment gains before tax ............. 2,030 4,761 4,399
Tax expense .................................. 708 1,658 1,528
Net unrealized investment gains at end of year ....... $1,322 $3,103 $2,871
Net unrealized investment gains at December 31, 2013 declined from the prior year-end, primarily
reflecting the impact of an increase in market interest rates during 2013. Net unrealized investment
gains at December 31, 2012 increased over the prior year-end, primarily reflecting the impact of a
decline in market interest rates during 2012.
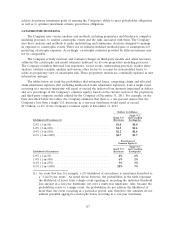
The following table summarizes, for all fixed maturities and equity securities reported at fair value
for which fair value is less than 80% of amortized cost at December 31, 2013, the gross unrealized
investment loss by length of time those securities have continuously been in an unrealized loss position
of greater than 20% of amortized cost:
Period For Which Fair Value Is Less Than 80% of Amortized Cost
Greater Than Greater Than
3 Months, 6 Months,
3 Months 6 Months 12 Months Greater Than
(in millions) or Less or Less or Less 12 Months Total
Fixed maturities:
Mortgage-backed securities ............ $— $— $— $— $—
Other ........................... 731314
Total fixed maturities ............... 731314
Equity securities ..................... —————
Total .............................. $7 $3 $1 $3 $14
115