Travelers 2013 Annual Report Download - page 131
Download and view the complete annual report
Please find page 131 of the 2013 Travelers annual report below. You can navigate through the pages in the report by either clicking on the pages listed below, or by using the keyword search tool below to find specific information within the annual report.-
 1
1 -
2
-
3
-
4
-
5
-
6
-
7
-
8
-
9
-
10
-
11
-
12
-
13
-
14
-
15
-
16
-
17
-
18
-
19
-
20
-
21
-
22
-
23
-
24
-
25
-
26
-
27
-
28
-
29
-
30
-
31
-
32
-
33
-
34
-
35
-
36
-
37
-
38
-
39
-
40
-
41
-
42
-
43
-
44
-
45
-
46
-
47
-
48
-
49
-
50
-
51
-
52
-
53
-
54
-
55
-
56
-
57
-
58
-
59
-
60
-
61
-
62
-
63
-
64
-
65
-
66
-
67
-
68
-
69
-
70
-
71
-
72
-
73
-
74
-
75
-
76
-
77
-
78
-
79
-
80
-
81
-
82
-
83
-
84
-
85
-
86
-
87
-
88
-
89
-
90
-
91
-
92
-
93
-
94
-
95
-
96
-
97
-
98
-
99
-
100
-
101
-
102
-
103
-
104
-
105
-
106
-
107
-
108
-
109
-
110
-
111
-
112
-
113
-
114
-
115
-
116
-
117
-
118
-
119
-
120
-
 121
121 -
 122
122 -
 123
123 -
 124
124 -
 125
125 -
 126
126 -
 127
127 -
 128
128 -
 129
129 -
 130
130 -
 131
131 -
 132
132 -
 133
133 -
 134
134 -
 135
135 -
 136
136 -
 137
137 -
 138
138 -
 139
139 -
 140
140 -
 141
141 -
142
-
143
-
144
-
145
-
146
-
147
-
148
-
149
-
150
-
151
-
152
-
153
-
154
-
155
-
156
-
157
-
158
-
159
-
160
-
161
-
162
-
163
-
164
-
165
-
166
-
167
-
168
-
169
-
170
-
171
-
172
-
173
-
174
-
175
-
176
-
177
-
178
-
179
-
180
-
181
-
182
-
183
-
184
-
185
-
186
-
187
-
188
-
189
-
190
-
191
-
192
-
193
-
194
-
195
-
196
-
197
-
198
-
199
-
200
-
201
-
202
-
203
-
204
-
205
-
206
-
207
-
208
-
209
-
210
-
211
-
212
-
213
-
214
-
215
-
216
-
217
-
218
-
219
-
220
-
221
-
222
-
223
-
224
-
225
-
226
-
227
-
228
-
229
-
230
-
231
-
232
-
233
-
234
-
235
-
236
-
237
-
238
-
239
-
240
-
241
-
242
-
243
-
244
-
245
-
246
-
247
-
248
-
249
-
250
-
251
-
252
-
253
-
254
-
255
-
256
-
257
-
258
-
259
-
260
-
261
-
262
-
263
-
264
-
265
-
266
-
267
-
268
-
269
-
270
-
271
-
272
-
273
-
274
-
275
-
276
-
277
-
278
-
279
-
280
-
281
-
282
-
283
-
284
-
285
-
286
-
287
-
288
-
289
-
290
-
291
-
292
-
293
-
294
-
295
-
296
-
297
-
298
-
299
-
300
-
301
-
302
-
303
-
304
 |
 |

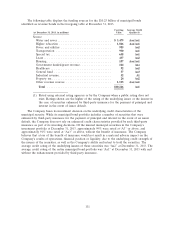
millions). Also included is the A.M. Best rating of the Company’s predominant insurer from each
insurer group at February 13, 2014:
Structured
Group Settlements A.M. Best Rating of Group’s Predominant Insurer
Fidelity & Guaranty Life Group ........... $972 B++ fifth highest of 16 ratings
MetLife Group ....................... 456 A+ second highest of 16 ratings
Genworth Financial Group .............. 429 A third highest of 16 ratings
John Hancock Group .................. 255 A+ second highest of 16 ratings
Symetra Financial Group ................ 248 A third highest of 16 ratings
Reinsurance companies and life insurance companies have been negatively impacted by turbulent
economic conditions, significant catastrophe events and investment portfolio challenges in recent years.
A number of such companies have been subjected to downgrades and/or negative outlook changes by
various ratings agencies, including those with which the Company conducts business. The Company
considers these factors in assessing the adequacy of its allowance for uncollectible amounts.
OUTLOOK
The following discussion provides outlook information for certain key drivers of the Company’s
results of operations and capital position.
Premiums. The Company’s earned premiums are a function of net written premium volume. Net
written premiums comprise both renewal business and new business and are recognized as earned
premium over the life of the underlying policies. When business renews, the amount of net written
premiums associated with that business may increase or decrease (renewal premium change) as a result
of increases or decreases in rate and/or insured exposures, which the Company considers as a measure
of units of exposure (such as the number and value of vehicles or properties insured). Net written
premiums from both renewal and new business, and therefore earned premiums, are impacted by
competitive market conditions as well as general economic conditions, which, particularly in the case of
the Business Insurance segment, affect audit premium adjustments, policy endorsements and mid-term
cancellations. Net written premiums are also impacted by the structure of reinsurance programs and
related costs.
Given the possibility that more active weather patterns such as the Company experienced in a
number of recent periods may continue, as well as the possibility that interest rates may remain low for
some period of time, along with the current level of profitability in certain of its product lines, the
Company has undertaken various efforts, and expects to undertake additional efforts, to improve its
underwriting margins. These efforts include seeking improved rates where the Company believes it is
appropriate, as well as improved terms and conditions, on many of its insurance products, and also
include other initiatives, such as reducing operating expenses and acquisition costs. In the Agency
Automobile line of business, given new business levels, the Company has undertaken various actions
(which are discussed in more detail in the ‘‘Underwriting Gain/Loss’’ section below) to reduce expenses
and costs in order to improve underwriting margins and enable it to have a more competitively priced
product. These and other actions to improve profitability with respect to Agency Automobile or the
Company’s other business units may not be successful and/or may result in lower retention and new
business levels and therefore lower business volumes. If these actions are not effective, the Company
may need to explore other actions or initiatives to improve its competitive position and profitability.
Refer to ‘‘Part I—Item 1A—Risk Factors—The intense competition that we face could harm our ability
to maintain or increase our business volumes and our profitability’’ and ‘‘—Disruptions to our
relationships with our independent agents and brokers could adversely affect us.’’
121