Travelers 2013 Annual Report Download - page 301
Download and view the complete annual report
Please find page 301 of the 2013 Travelers annual report below. You can navigate through the pages in the report by either clicking on the pages listed below, or by using the keyword search tool below to find specific information within the annual report.-
 1
1 -
2
-
3
-
4
-
5
-
6
-
7
-
8
-
9
-
10
-
11
-
12
-
13
-
14
-
15
-
16
-
17
-
18
-
19
-
20
-
21
-
22
-
23
-
24
-
25
-
26
-
27
-
28
-
29
-
30
-
31
-
32
-
33
-
34
-
35
-
36
-
37
-
38
-
39
-
40
-
41
-
42
-
43
-
44
-
45
-
46
-
47
-
48
-
49
-
50
-
51
-
52
-
53
-
54
-
55
-
56
-
57
-
58
-
59
-
60
-
61
-
62
-
63
-
64
-
65
-
66
-
67
-
68
-
69
-
70
-
71
-
72
-
73
-
74
-
75
-
76
-
77
-
78
-
79
-
80
-
81
-
82
-
83
-
84
-
85
-
86
-
87
-
88
-
89
-
90
-
91
-
92
-
93
-
94
-
95
-
96
-
97
-
98
-
99
-
100
-
101
-
102
-
103
-
104
-
105
-
106
-
107
-
108
-
109
-
110
-
111
-
112
-
113
-
114
-
115
-
116
-
117
-
118
-
119
-
120
-
121
-
122
-
123
-
124
-
125
-
126
-
127
-
128
-
129
-
130
-
131
-
132
-
133
-
134
-
135
-
136
-
137
-
138
-
139
-
140
-
141
-
142
-
143
-
144
-
145
-
146
-
147
-
148
-
149
-
150
-
151
-
152
-
153
-
154
-
155
-
156
-
157
-
158
-
159
-
160
-
161
-
162
-
163
-
164
-
165
-
166
-
167
-
168
-
169
-
170
-
171
-
172
-
173
-
174
-
175
-
176
-
177
-
178
-
179
-
180
-
181
-
182
-
183
-
184
-
185
-
186
-
187
-
188
-
189
-
190
-
191
-
192
-
193
-
194
-
195
-
196
-
197
-
198
-
199
-
200
-
201
-
202
-
203
-
204
-
205
-
206
-
207
-
208
-
209
-
210
-
211
-
212
-
213
-
214
-
215
-
216
-
217
-
218
-
219
-
220
-
221
-
222
-
223
-
224
-
225
-
226
-
227
-
228
-
229
-
230
-
231
-
232
-
233
-
234
-
235
-
236
-
237
-
238
-
239
-
240
-
241
-
242
-
243
-
244
-
245
-
246
-
247
-
248
-
249
-
250
-
251
-
252
-
253
-
254
-
255
-
256
-
257
-
258
-
259
-
260
-
261
-
262
-
263
-
264
-
265
-
266
-
267
-
268
-
269
-
270
-
271
-
272
-
273
-
274
-
275
-
276
-
277
-
278
-
279
-
280
-
281
-
282
-
283
-
284
-
285
-
286
-
287
-
288
-
289
-
290
-
 291
291 -
 292
292 -
 293
293 -
 294
294 -
 295
295 -
 296
296 -
 297
297 -
 298
298 -
 299
299 -
 300
300 -
 301
301 -
 302
302 -
 303
303 -
 304
304
 |
 |

Shareholders’ information
Your Dividends
The Travelers Companies, Inc. has paid cash dividends without interruption
for 142 years. Our most recent quarterly dividend of $0.50 per share was
declared on January 21, 2014, payable March 31, 2014, to shareholders of
record as of March 10, 2014.
Automatic Dividend Reinvestment Program
This program provides a convenient opportunity for our shareholders to
increase their holding of Travelers common stock. An explanatory brochure
and enrollment card may be obtained by calling our stock transfer agent,
Wells Fargo Bank, N.A., at 888.326.5102, or mailing a request to the
address below.
Stock Transfer Agent and Registrar
For address changes, dividend checks, direct deposits of dividends,
account consolidations, registration changes, lost stock certifi cates and
general stock holding questions, please contact:
Wells Fargo Bank, N.A. Toll Free: 888.326.5102
Shareowner Services Outside U.S. and Canada: 651.450.4064
P.O. Box 64854 www.shareowneronline.com
Saint Paul, MN 55164-0854
Financial Information Available
Travelers makes available, free of charge on its website, all of its fi lings that
are made electronically to the SEC, including Forms 10-K, 10-Q, and 8-K.
To access these fi lings, go to travelers.com > For Investors > SEC Filings.
Requests for additional information may be directed to:
The Travelers Companies, Inc. Investor Relations, 2MS
One Tower Square Attn: Marc Parr
Hartford, CT 06183 860.277.0779
mparr@travelers.com
Annual Meeting of Shareholders
The Annual Meeting of Shareholders will be held on May 27, 2014,
at The Hartford Marriott Downtown, 200 Columbus Boulevard,
Hartford, CT 06103. As publicly announced, this date supersedes
the prior date announced in the Form 10-K. In April, we plan to send
proxy materials, or a notice of internet availability of proxy materials, to
shareholders of record as of the close of business on March 31, 2014.
The notice will provide instructions on where to access our Proxy Statement
and Annual Report as well as how to vote your shares electronically. The
notice also includes instructions on how to request a printed copy of our
proxy materials.
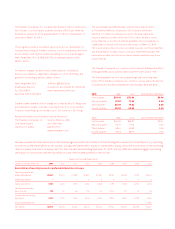
Stock Price and Dividend Rate
The Travelers Companies, Inc. common stock is listed on the New York Stock
Exchange (NYSE) and is publicly traded under the ticker symbol “TRV”.
The following tables set forth the quarterly high and low closing sales
prices of The Travelers Companies, Inc. common stock as well as the amount
of quarterly cash dividends declared per share for years 2013 and 2012.
High Low Cash Dividend Declared
First Quarter
Second Quarter
Third Quarter
Fourth Quarter
2012 High Low Cash Dividend Declared
First Quarter $61.59 $56.87 $0.41
Second Quarter 64.77 57.75 0.46
Third Quarter 68.61 60.89 0.46
Fourth Quarter 74.33 68.07 0.46
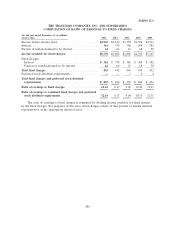
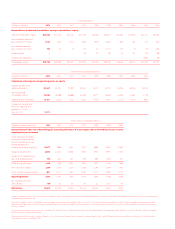
Additional information
We have included the tables below and on the reverse page to provide a reconciliation of the following items used in this Annual Report: (i) operating
income less preferred dividends to net income, (ii) adjusted shareholders’ equity to shareholders’ equity, which are components of the operating
return on equity and return on equity ratios for the nine-year period ending December 31, 2013, and (iii) after-tax underwriting gain (excluding
the impact of catastrophes and net favorable prior year reserve development) to net income.
Twelve months ended December 31,
(Dollars in millions, after-tax) 2012 2011 2010 2009 2008 2007 2006 2005
Reconciliation of operating income less preferred dividends to net income
Operating income, less
preferred dividends $2,441 $1,389 $3,040 $3,597 $3,191 $4,496 4,195 $2,020
Preferred dividends – 1 3 3 4 4 5 6
Operating income 2,441 1,390 3,043 3,600 3,195 4,500 4,200 2,026
Net realized investment
gains (losses) 32 36 173 22 (271) 101 8 35
Income from continuing
operations 2,473 1,426 3,216 3,622 2,924 4,601 4,208 2,061
Discontinued operations – – – – – – – (439)
Net income $2,473 $1,426 $3,216 $3,622 $2,924 $4,601 $4,208 $1,622