Travelers 2013 Annual Report Download - page 103
Download and view the complete annual report
Please find page 103 of the 2013 Travelers annual report below. You can navigate through the pages in the report by either clicking on the pages listed below, or by using the keyword search tool below to find specific information within the annual report.-
 1
1 -
2
-
3
-
4
-
5
-
6
-
7
-
8
-
9
-
10
-
11
-
12
-
13
-
14
-
15
-
16
-
17
-
18
-
19
-
20
-
21
-
22
-
23
-
24
-
25
-
26
-
27
-
28
-
29
-
30
-
31
-
32
-
33
-
34
-
35
-
36
-
37
-
38
-
39
-
40
-
41
-
42
-
43
-
44
-
45
-
46
-
47
-
48
-
49
-
50
-
51
-
52
-
53
-
54
-
55
-
56
-
57
-
58
-
59
-
60
-
61
-
62
-
63
-
64
-
65
-
66
-
67
-
68
-
69
-
70
-
71
-
72
-
73
-
74
-
75
-
76
-
77
-
78
-
79
-
80
-
81
-
82
-
83
-
84
-
85
-
86
-
87
-
88
-
89
-
90
-
91
-
92
-
 93
93 -
 94
94 -
 95
95 -
 96
96 -
 97
97 -
 98
98 -
 99
99 -
 100
100 -
 101
101 -
 102
102 -
 103
103 -
 104
104 -
 105
105 -
 106
106 -
 107
107 -
 108
108 -
 109
109 -
 110
110 -
 111
111 -
 112
112 -
 113
113 -
114
-
115
-
116
-
117
-
118
-
119
-
120
-
121
-
122
-
123
-
124
-
125
-
126
-
127
-
128
-
129
-
130
-
131
-
132
-
133
-
134
-
135
-
136
-
137
-
138
-
139
-
140
-
141
-
142
-
143
-
144
-
145
-
146
-
147
-
148
-
149
-
150
-
151
-
152
-
153
-
154
-
155
-
156
-
157
-
158
-
159
-
160
-
161
-
162
-
163
-
164
-
165
-
166
-
167
-
168
-
169
-
170
-
171
-
172
-
173
-
174
-
175
-
176
-
177
-
178
-
179
-
180
-
181
-
182
-
183
-
184
-
185
-
186
-
187
-
188
-
189
-
190
-
191
-
192
-
193
-
194
-
195
-
196
-
197
-
198
-
199
-
200
-
201
-
202
-
203
-
204
-
205
-
206
-
207
-
208
-
209
-
210
-
211
-
212
-
213
-
214
-
215
-
216
-
217
-
218
-
219
-
220
-
221
-
222
-
223
-
224
-
225
-
226
-
227
-
228
-
229
-
230
-
231
-
232
-
233
-
234
-
235
-
236
-
237
-
238
-
239
-
240
-
241
-
242
-
243
-
244
-
245
-
246
-
247
-
248
-
249
-
250
-
251
-
252
-
253
-
254
-
255
-
256
-
257
-
258
-
259
-
260
-
261
-
262
-
263
-
264
-
265
-
266
-
267
-
268
-
269
-
270
-
271
-
272
-
273
-
274
-
275
-
276
-
277
-
278
-
279
-
280
-
281
-
282
-
283
-
284
-
285
-
286
-
287
-
288
-
289
-
290
-
291
-
292
-
293
-
294
-
295
-
296
-
297
-
298
-
299
-
300
-
301
-
302
-
303
-
304
 |
 |
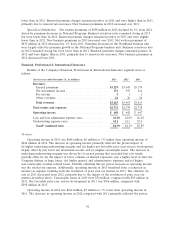
declines in (i) net favorable prior year reserve development and (ii) net investment income, largely
offset by (iii) higher underlying underwriting margins. The increase in underlying underwriting margins
resulted from the pretax impact of (i) lower levels of what the Company defines as large losses and
(ii) earned pricing that exceeded loss cost trends, partially offset by (iii) the impact of lower volumes of
insured exposures. Partially offsetting this net pretax decrease in operating income was the related
reduction in tax expense. Additionally, tax expense in 2011 was reduced by the resolution of prior year
tax matters. The effective tax rate in 2012 increased over 2011, primarily due to the impact of the
resolution of prior year tax matters in 2011 described above. Net favorable prior year reserve
development in 2012 was $298 million, compared with $360 million in 2011. Catastrophe losses in 2012
were $50 million, compared with $55 million in 2011.
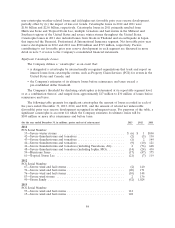
Revenues
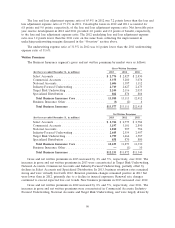
Earned Premiums
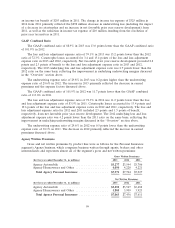
Earned premiums in 2013 were $3.23 billion, $184 million or 6% higher than in 2012, primarily
reflecting the impact of the acquisition of Dominion.
Earned premiums in 2012 were $3.05 billion, $129 million or 4% lower than in 2011, primarily
reflecting the impact of lower construction surety premium volumes over the preceding twelve months,
intentional underwriting actions undertaken in the Company’s operations at Lloyd’s intended to
improve risk and reward (particularly in the catastrophe-exposed lines of business), the impact of the
termination of an exclusive broker relationship in the Republic of Ireland, the Company’s withdrawal
from personal insurance business in the Republic of Ireland, competitive market conditions and, to a
lesser extent, foreign currency rates of exchange.
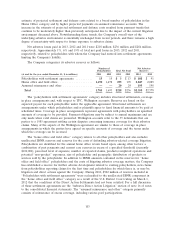
Net Investment Income
Net investment income in 2013 was $372 million, $23 million or 6% lower than in 2012. Net
investment income in 2012 was $395 million, $19 million or 5% lower than in 2011. Included in the
Financial, Professional & International Insurance segment are certain legal entities whose invested
assets and related net investment income are reported exclusively in this segment and not allocated
among all business segments. As a result, reported net investment income in the Financial,
Professional & International Insurance segment reflects a significantly smaller proportion of allocated
net investment income, including that from the Company’s non-fixed maturity investments that
experienced a decrease in investment income in 2013 and an increase in investment income in 2012.
Net investment income in 2013 also benefited from the acquisition of Dominion. Refer to the ‘‘Net
Investment Income’’ section of the ‘‘Consolidated Results of Operations’’ discussion herein for a
description of the factors contributing to the changes in the Company’s consolidated net investment
income in 2013 and 2012 compared with the respective prior years. In addition, refer to note 2 of notes
to the Company’s consolidated financial statements herein for a discussion of the Company’s net
investment income allocation methodology.
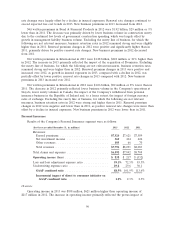
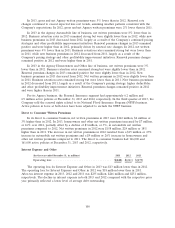
Claims and Expenses
Claims and Claim Adjustment Expenses
Claims and claim adjustment expenses in 2013 were $1.40 billion, $90 million or 7% higher than in
2012, primarily reflecting (i) the impact of the acquisition of Dominion, (ii) a higher level of what the
Company defines as large losses, (iii) higher non-catastrophe weather-related losses and (iv) an increase
in catastrophe losses, partially offset by (v) reduced loss cost trends, (vi) the impact of lower volumes
of insured exposures and (vii) higher net favorable prior year reserve development. Catastrophe losses
in 2013 were $56 million, primarily resulting from floods in Alberta, Canada, and Storm Xaver in the
United Kingdom, compared with $50 million in 2012, which primarily resulted from Storm Sandy. Net
favorable prior year reserve development in 2013 was $306 million, compared with $298 million in
2012. Factors contributing to net favorable prior year reserve development are discussed in more detail
in note 7 of notes to the Company’s consolidated financial statements.
93