Travelers 2013 Annual Report Download - page 241
Download and view the complete annual report
Please find page 241 of the 2013 Travelers annual report below. You can navigate through the pages in the report by either clicking on the pages listed below, or by using the keyword search tool below to find specific information within the annual report.-
 1
1 -
2
-
3
-
4
-
5
-
6
-
7
-
8
-
9
-
10
-
11
-
12
-
13
-
14
-
15
-
16
-
17
-
18
-
19
-
20
-
21
-
22
-
23
-
24
-
25
-
26
-
27
-
28
-
29
-
30
-
31
-
32
-
33
-
34
-
35
-
36
-
37
-
38
-
39
-
40
-
41
-
42
-
43
-
44
-
45
-
46
-
47
-
48
-
49
-
50
-
51
-
52
-
53
-
54
-
55
-
56
-
57
-
58
-
59
-
60
-
61
-
62
-
63
-
64
-
65
-
66
-
67
-
68
-
69
-
70
-
71
-
72
-
73
-
74
-
75
-
76
-
77
-
78
-
79
-
80
-
81
-
82
-
83
-
84
-
85
-
86
-
87
-
88
-
89
-
90
-
91
-
92
-
93
-
94
-
95
-
96
-
97
-
98
-
99
-
100
-
101
-
102
-
103
-
104
-
105
-
106
-
107
-
108
-
109
-
110
-
111
-
112
-
113
-
114
-
115
-
116
-
117
-
118
-
119
-
120
-
121
-
122
-
123
-
124
-
125
-
126
-
127
-
128
-
129
-
130
-
131
-
132
-
133
-
134
-
135
-
136
-
137
-
138
-
139
-
140
-
141
-
142
-
143
-
144
-
145
-
146
-
147
-
148
-
149
-
150
-
151
-
152
-
153
-
154
-
155
-
156
-
157
-
158
-
159
-
160
-
161
-
162
-
163
-
164
-
165
-
166
-
167
-
168
-
169
-
170
-
171
-
172
-
173
-
174
-
175
-
176
-
177
-
178
-
179
-
180
-
181
-
182
-
183
-
184
-
185
-
186
-
187
-
188
-
189
-
190
-
191
-
192
-
193
-
194
-
195
-
196
-
197
-
198
-
199
-
200
-
201
-
202
-
203
-
204
-
205
-
206
-
207
-
208
-
209
-
210
-
211
-
212
-
213
-
214
-
215
-
216
-
217
-
218
-
219
-
220
-
221
-
222
-
223
-
224
-
225
-
226
-
227
-
228
-
229
-
230
-
 231
231 -
 232
232 -
 233
233 -
 234
234 -
 235
235 -
 236
236 -
 237
237 -
 238
238 -
 239
239 -
 240
240 -
 241
241 -
 242
242 -
 243
243 -
 244
244 -
 245
245 -
 246
246 -
 247
247 -
 248
248 -
 249
249 -
 250
250 -
 251
251 -
252
-
253
-
254
-
255
-
256
-
257
-
258
-
259
-
260
-
261
-
262
-
263
-
264
-
265
-
266
-
267
-
268
-
269
-
270
-
271
-
272
-
273
-
274
-
275
-
276
-
277
-
278
-
279
-
280
-
281
-
282
-
283
-
284
-
285
-
286
-
287
-
288
-
289
-
290
-
291
-
292
-
293
-
294
-
295
-
296
-
297
-
298
-
299
-
300
-
301
-
302
-
303
-
304
 |
 |

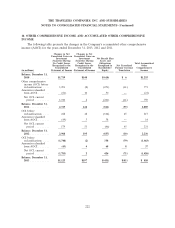
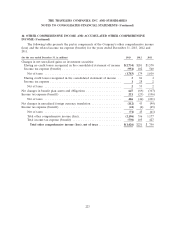
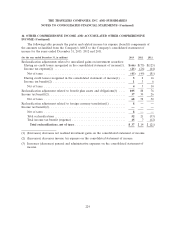
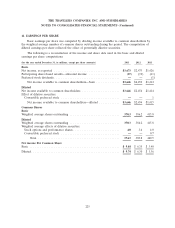
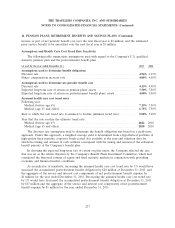
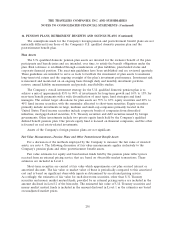
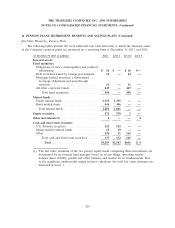
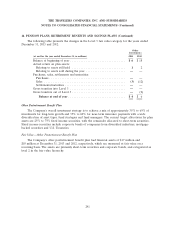
THE TRAVELERS COMPANIES, INC. AND SUBSIDIARIES
NOTES TO CONSOLIDATED FINANCIAL STATEMENTS (Continued)
13. SHARE-BASED INCENTIVE COMPENSATION (Continued)
2011 Original Grants Reload Grants
Expected term of stock options .............. 6 years 1 year
Expected volatility of the Company’s stock ...... 28.0% - 28.6% 15.7% - 17.6%
Weighted average volatility .................. 28.2% 15.9%
Expected annual dividend per share ........... $1.44 - $1.64 $1.44 - $1.64
Risk-free rate ........................... 1.19% - 2.62% 0.10% - 0.29%
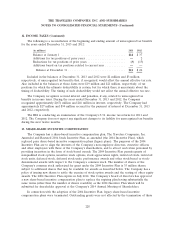
A summary of stock option activity under the Company’s 2004 Incentive Plan and legacy share-
based incentive compensation plans as of and for the year ended December 31, 2013 is as follows:
Weighted
Weighted Average Aggregate
Average Contractual Intrinsic
Exercise Life Value
Stock Options Number Price Remaining ($ in millions)
Outstanding, beginning of year ........... 12,596,208 $50.58
Original grants ...................... 1,862,670 78.65
Exercised .......................... (3,320,511) 45.72
Forfeited or expired .................. (67,111) 63.13
Outstanding, end of year ............... 11,071,256 $56.68 6.3 Years $375
Vested at end of year(1) ............... 7,796,550 $53.40 5.6 Years $290
Exercisable at end of year .............. 4,888,957 $47.05 4.1 Years $213
(1) Represents awards for which the requisite service has been rendered, including those that are
retirement eligible.
The following table presents additional information regarding original and reload grants for the
years ended December 31, 2013, 2012 and 2011.
2013 Original Grants
Weighted average grant-date fair value of options granted (per share) . . . $17.09
Total intrinsic value of options exercised during the year (in millions) . . . $ 122
2012 Original Grants Reload Grants
Weighted average grant-date fair value of options granted (per share) . . . $12.08 $4.49
Total intrinsic value of options exercised during the year (in millions) . . . $ 102 $ 5
2011 Original Grants Reload Grants
Weighted average grant-date fair value of options granted (per share) . . . $12.94 $3.19
Total intrinsic value of options exercised during the year (in millions) . . . $ 76 $ 11
On February 4, 2014, the Company, under the 2004 Stock Incentive Plan, granted 2,009,087 stock
option awards with an exercise price of $80.35 per share. The fair value attributable to the stock option
awards on the date of grant was $17.22 per share.
231