Travelers 2013 Annual Report Download - page 170
Download and view the complete annual report
Please find page 170 of the 2013 Travelers annual report below. You can navigate through the pages in the report by either clicking on the pages listed below, or by using the keyword search tool below to find specific information within the annual report.-
 1
1 -
2
-
3
-
4
-
5
-
6
-
7
-
8
-
9
-
10
-
11
-
12
-
13
-
14
-
15
-
16
-
17
-
18
-
19
-
20
-
21
-
22
-
23
-
24
-
25
-
26
-
27
-
28
-
29
-
30
-
31
-
32
-
33
-
34
-
35
-
36
-
37
-
38
-
39
-
40
-
41
-
42
-
43
-
44
-
45
-
46
-
47
-
48
-
49
-
50
-
51
-
52
-
53
-
54
-
55
-
56
-
57
-
58
-
59
-
60
-
61
-
62
-
63
-
64
-
65
-
66
-
67
-
68
-
69
-
70
-
71
-
72
-
73
-
74
-
75
-
76
-
77
-
78
-
79
-
80
-
81
-
82
-
83
-
84
-
85
-
86
-
87
-
88
-
89
-
90
-
91
-
92
-
93
-
94
-
95
-
96
-
97
-
98
-
99
-
100
-
101
-
102
-
103
-
104
-
105
-
106
-
107
-
108
-
109
-
110
-
111
-
112
-
113
-
114
-
115
-
116
-
117
-
118
-
119
-
120
-
121
-
122
-
123
-
124
-
125
-
126
-
127
-
128
-
129
-
130
-
131
-
132
-
133
-
134
-
135
-
136
-
137
-
138
-
139
-
140
-
141
-
142
-
143
-
144
-
145
-
146
-
147
-
148
-
149
-
150
-
151
-
152
-
153
-
154
-
155
-
156
-
157
-
158
-
159
-
 160
160 -
 161
161 -
 162
162 -
 163
163 -
 164
164 -
 165
165 -
 166
166 -
 167
167 -
 168
168 -
 169
169 -
 170
170 -
 171
171 -
 172
172 -
 173
173 -
 174
174 -
 175
175 -
 176
176 -
 177
177 -
 178
178 -
 179
179 -
 180
180 -
181
-
182
-
183
-
184
-
185
-
186
-
187
-
188
-
189
-
190
-
191
-
192
-
193
-
194
-
195
-
196
-
197
-
198
-
199
-
200
-
201
-
202
-
203
-
204
-
205
-
206
-
207
-
208
-
209
-
210
-
211
-
212
-
213
-
214
-
215
-
216
-
217
-
218
-
219
-
220
-
221
-
222
-
223
-
224
-
225
-
226
-
227
-
228
-
229
-
230
-
231
-
232
-
233
-
234
-
235
-
236
-
237
-
238
-
239
-
240
-
241
-
242
-
243
-
244
-
245
-
246
-
247
-
248
-
249
-
250
-
251
-
252
-
253
-
254
-
255
-
256
-
257
-
258
-
259
-
260
-
261
-
262
-
263
-
264
-
265
-
266
-
267
-
268
-
269
-
270
-
271
-
272
-
273
-
274
-
275
-
276
-
277
-
278
-
279
-
280
-
281
-
282
-
283
-
284
-
285
-
286
-
287
-
288
-
289
-
290
-
291
-
292
-
293
-
294
-
295
-
296
-
297
-
298
-
299
-
300
-
301
-
302
-
303
-
304
 |
 |
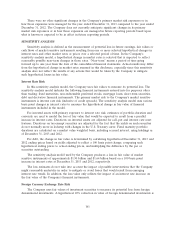
Item 7A. QUANTITATIVE AND QUALITATIVE DISCLOSURES ABOUT MARKET RISK
MARKET RISK
Market risk is the risk of loss arising from adverse changes in market rates and prices, such as
interest rates (inclusive of credit spreads), foreign currency exchange rates and other relevant market
rate or price changes. Market risk is directly influenced by the volatility and liquidity in the markets in
which the related underlying assets are traded. The following is a discussion of the Company’s primary
market risk exposures and how those exposures are managed as of December 31, 2013. The Company’s
market risk sensitive instruments, including derivatives, are primarily entered into for purposes other
than trading.
The carrying value of the Company’s investment portfolio at December 31, 2013 and 2012 was
$73.16 billion and $73.84 billion, respectively, of which 87% and 89% was invested in fixed maturity
securities, respectively. At December 31, 2013 and 2012, approximately 9.3% and 6.2%, respectively, of
the Company’s invested assets were denominated in foreign currencies. The increase at December 31,
2013 primarily reflected the impact of the Company’s acquisition of Dominion. The Company’s
exposure to equity price risk is not significant. The Company has no direct commodity risk and is not a
party to any credit default swaps.
The primary market risks to the investment portfolio are interest rate risk and credit risk
associated with investments in fixed maturity securities. The portfolio duration is primarily managed
through cash market transactions and treasury futures transactions. In 2013, the estimated average
effective duration of the Company’s portfolio of fixed maturity and short-term security investments
increased, primarily reflecting the impact of an increase in interest rates during the year. By the end of
the second quarter of 2013, based upon the outlook for interest rates, the Company closed all of its
short positions in U.S. Treasury futures contracts, which it had used to reduce the Company’s exposure
to a decrease in its book value resulting from an increase in interest rates. During the second half of
2013, the Company did not enter into any U.S. Treasury futures contracts. The Company may once
again enter into positions in U.S. Treasury futures in future periods to help manage the duration of its
investment portfolio. For additional information regarding the Company’s investments, see notes 3 and
4 of notes to the Company’s consolidated financial statements as well as the ‘‘Investment Portfolio’’ and
‘‘Outlook’’ sections of ‘‘Item 7—Management’s Discussion and Analysis of Financial Condition and
Results of Operations.’’
The primary market risk for all of the Company’s debt is interest rate risk at the time of
refinancing. The Company monitors the interest rate environment and evaluates refinancing
opportunities as maturity dates approach. For additional information regarding the Company’s debt see
note 8 of notes to the Company’s consolidated financial statements as well as the ‘‘Liquidity and
Capital Resources’’ section of ‘‘Item 7—Management’s Discussion and Analysis of Financial Condition
and Results of Operations.’’
The Company’s foreign exchange market risk exposure is concentrated in the Company’s invested
assets, insurance reserves and shareholders’ equity denominated in foreign currencies. Cash flows from
the Company’s foreign operations are the primary source of funds for the purchase of investments
denominated in foreign currencies. The Company purchases these investments primarily to fund
insurance reserves and other liabilities denominated in the same currency, effectively reducing its
foreign currency exchange rate exposure. Invested assets denominated in the Canadian dollar
comprised approximately 5.5% and 2.3% of the total invested assets at December 31, 2013 and 2012,
respectively. The increase at December 31, 2013 primarily reflected the impact of the Company’s
acquisition of Dominion. Invested assets denominated in the British Pound Sterling comprised
approximately 2.4% of the total invested assets at both December 31, 2013 and 2012. Invested assets
denominated in other currencies at December 31, 2013 and 2012 were not material.
160