Travelers 2013 Annual Report Download - page 127
Download and view the complete annual report
Please find page 127 of the 2013 Travelers annual report below. You can navigate through the pages in the report by either clicking on the pages listed below, or by using the keyword search tool below to find specific information within the annual report.-
 1
1 -
2
-
3
-
4
-
5
-
6
-
7
-
8
-
9
-
10
-
11
-
12
-
13
-
14
-
15
-
16
-
17
-
18
-
19
-
20
-
21
-
22
-
23
-
24
-
25
-
26
-
27
-
28
-
29
-
30
-
31
-
32
-
33
-
34
-
35
-
36
-
37
-
38
-
39
-
40
-
41
-
42
-
43
-
44
-
45
-
46
-
47
-
48
-
49
-
50
-
51
-
52
-
53
-
54
-
55
-
56
-
57
-
58
-
59
-
60
-
61
-
62
-
63
-
64
-
65
-
66
-
67
-
68
-
69
-
70
-
71
-
72
-
73
-
74
-
75
-
76
-
77
-
78
-
79
-
80
-
81
-
82
-
83
-
84
-
85
-
86
-
87
-
88
-
89
-
90
-
91
-
92
-
93
-
94
-
95
-
96
-
97
-
98
-
99
-
100
-
101
-
102
-
103
-
104
-
105
-
106
-
107
-
108
-
109
-
110
-
111
-
112
-
113
-
114
-
115
-
116
-
 117
117 -
 118
118 -
 119
119 -
 120
120 -
 121
121 -
 122
122 -
 123
123 -
 124
124 -
 125
125 -
 126
126 -
 127
127 -
 128
128 -
 129
129 -
 130
130 -
 131
131 -
 132
132 -
 133
133 -
 134
134 -
 135
135 -
 136
136 -
 137
137 -
138
-
139
-
140
-
141
-
142
-
143
-
144
-
145
-
146
-
147
-
148
-
149
-
150
-
151
-
152
-
153
-
154
-
155
-
156
-
157
-
158
-
159
-
160
-
161
-
162
-
163
-
164
-
165
-
166
-
167
-
168
-
169
-
170
-
171
-
172
-
173
-
174
-
175
-
176
-
177
-
178
-
179
-
180
-
181
-
182
-
183
-
184
-
185
-
186
-
187
-
188
-
189
-
190
-
191
-
192
-
193
-
194
-
195
-
196
-
197
-
198
-
199
-
200
-
201
-
202
-
203
-
204
-
205
-
206
-
207
-
208
-
209
-
210
-
211
-
212
-
213
-
214
-
215
-
216
-
217
-
218
-
219
-
220
-
221
-
222
-
223
-
224
-
225
-
226
-
227
-
228
-
229
-
230
-
231
-
232
-
233
-
234
-
235
-
236
-
237
-
238
-
239
-
240
-
241
-
242
-
243
-
244
-
245
-
246
-
247
-
248
-
249
-
250
-
251
-
252
-
253
-
254
-
255
-
256
-
257
-
258
-
259
-
260
-
261
-
262
-
263
-
264
-
265
-
266
-
267
-
268
-
269
-
270
-
271
-
272
-
273
-
274
-
275
-
276
-
277
-
278
-
279
-
280
-
281
-
282
-
283
-
284
-
285
-
286
-
287
-
288
-
289
-
290
-
291
-
292
-
293
-
294
-
295
-
296
-
297
-
298
-
299
-
300
-
301
-
302
-
303
-
304
 |
 |

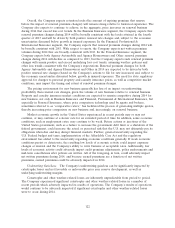
achieve its primary investment goals of assuring the Company’s ability to meet policyholder obligations
as well as to optimize investment returns, given these obligations.
CATASTROPHE MODELING
The Company uses various analyses and methods, including proprietary and third-party computer
modeling processes, to analyze catastrophic events and the risks associated with them. The Company
uses these analyses and methods to make underwriting and reinsurance decisions designed to manage
its exposure to catastrophic events. There are no industry-standard methodologies or assumptions for
projecting catastrophe exposure. Accordingly, catastrophe estimates provided by different insurers may
not be comparable.
The Company actively monitors and evaluates changes in third-party models and, when necessary,
calibrates the catastrophe risk model estimates delivered via its own proprietary modeling processes.
The Company considers historical loss experience, recent events, underwriting practices, market share
analyses, external scientific analysis and various other factors to account for non-modeled losses to
refine its proprietary view of catastrophe risk. These proprietary models are continually updated as new
information emerges.
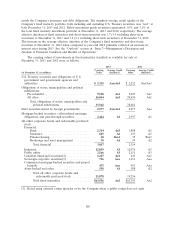
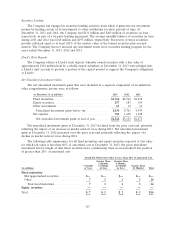
The tables below set forth the probabilities that estimated losses, comprising claims and allocated
claim adjustment expenses (but excluding unallocated claim adjustment expenses), from a single event
occurring in a one-year timeframe will equal or exceed the indicated loss amounts (expressed in dollars
and as a percentage of the Company’s common equity), based on the current version of the proprietary
and third-party computer models utilized by the Company at December 31, 2013. For example, on the
basis described below the tables, the Company estimates that there is a one percent chance that the
Company’s loss from a single U.S. hurricane in a one-year timeframe would equal or exceed
$1.3 billion, or 6% of the Company’s common equity at December 31, 2013.
Dollars (in billions)
Single U.S.
Single U.S. and Canadian
Likelihood of Exceedance(1) Hurricane Earthquake
2.0% (1-in-50) ................................. $1.0 $0.4
1.0% (1-in-100) ................................. $1.3 $0.6
0.4% (1-in-250) ................................. $2.2 $0.8
0.1% (1-in-1,000) ............................... $4.7 $1.7
Percentage of
Common Equity(2)
Single U.S.
Single U.S. and Canadian
Likelihood of Exceedance Hurricane Earthquake
2.0% (1-in-50) ................................. 4% 2%
1.0% (1-in-100) ................................. 6% 2%
0.4% (1-in-250) ................................. 9% 3%
0.1% (1-in-1,000) ............................... 20% 7%
(1) An event that has, for example, a 2% likelihood of exceedance is sometimes described as
a ‘‘1-in-50 year event.’’ As noted above, however, the probabilities in the table represent
the likelihood of losses from a single event equaling or exceeding the indicated threshold
loss amount in a one-year timeframe, not over a multi-year timeframe. Also, because the
probabilities relate to a single event, the probabilities do not address the likelihood of
more than one event occurring in a particular period, and, therefore, the amounts do not
address potential aggregate catastrophe losses occurring in a one-year timeframe.
117