Travelers 2013 Annual Report Download - page 92
Download and view the complete annual report
Please find page 92 of the 2013 Travelers annual report below. You can navigate through the pages in the report by either clicking on the pages listed below, or by using the keyword search tool below to find specific information within the annual report.-
 1
1 -
2
-
3
-
4
-
5
-
6
-
7
-
8
-
9
-
10
-
11
-
12
-
13
-
14
-
15
-
16
-
17
-
18
-
19
-
20
-
21
-
22
-
23
-
24
-
25
-
26
-
27
-
28
-
29
-
30
-
31
-
32
-
33
-
34
-
35
-
36
-
37
-
38
-
39
-
40
-
41
-
42
-
43
-
44
-
45
-
46
-
47
-
48
-
49
-
50
-
51
-
52
-
53
-
54
-
55
-
56
-
57
-
58
-
59
-
60
-
61
-
62
-
63
-
64
-
65
-
66
-
67
-
68
-
69
-
70
-
71
-
72
-
73
-
74
-
75
-
76
-
77
-
78
-
79
-
80
-
81
-
 82
82 -
 83
83 -
 84
84 -
 85
85 -
 86
86 -
 87
87 -
 88
88 -
 89
89 -
 90
90 -
 91
91 -
 92
92 -
 93
93 -
 94
94 -
 95
95 -
 96
96 -
 97
97 -
 98
98 -
 99
99 -
 100
100 -
 101
101 -
 102
102 -
103
-
104
-
105
-
106
-
107
-
108
-
109
-
110
-
111
-
112
-
113
-
114
-
115
-
116
-
117
-
118
-
119
-
120
-
121
-
122
-
123
-
124
-
125
-
126
-
127
-
128
-
129
-
130
-
131
-
132
-
133
-
134
-
135
-
136
-
137
-
138
-
139
-
140
-
141
-
142
-
143
-
144
-
145
-
146
-
147
-
148
-
149
-
150
-
151
-
152
-
153
-
154
-
155
-
156
-
157
-
158
-
159
-
160
-
161
-
162
-
163
-
164
-
165
-
166
-
167
-
168
-
169
-
170
-
171
-
172
-
173
-
174
-
175
-
176
-
177
-
178
-
179
-
180
-
181
-
182
-
183
-
184
-
185
-
186
-
187
-
188
-
189
-
190
-
191
-
192
-
193
-
194
-
195
-
196
-
197
-
198
-
199
-
200
-
201
-
202
-
203
-
204
-
205
-
206
-
207
-
208
-
209
-
210
-
211
-
212
-
213
-
214
-
215
-
216
-
217
-
218
-
219
-
220
-
221
-
222
-
223
-
224
-
225
-
226
-
227
-
228
-
229
-
230
-
231
-
232
-
233
-
234
-
235
-
236
-
237
-
238
-
239
-
240
-
241
-
242
-
243
-
244
-
245
-
246
-
247
-
248
-
249
-
250
-
251
-
252
-
253
-
254
-
255
-
256
-
257
-
258
-
259
-
260
-
261
-
262
-
263
-
264
-
265
-
266
-
267
-
268
-
269
-
270
-
271
-
272
-
273
-
274
-
275
-
276
-
277
-
278
-
279
-
280
-
281
-
282
-
283
-
284
-
285
-
286
-
287
-
288
-
289
-
290
-
291
-
292
-
293
-
294
-
295
-
296
-
297
-
298
-
299
-
300
-
301
-
302
-
303
-
304
 |
 |

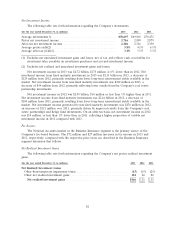
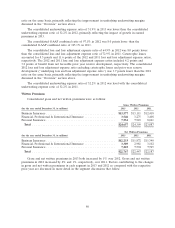
Net Investment Income
The following table sets forth information regarding the Company’s investments.
(for the year ended December 31, in millions) 2013 2012 2011
Average investments(1) ..................................... $70,697 $69,863 $70,471
Pretax net investment income ................................ 2,716 2,889 2,879
After-tax net investment income .............................. 2,186 2,316 2,330
Average pretax yield(2) .................................... 3.8% 4.1% 4.1%
Average after-tax yield(2) ................................... 3.1% 3.3% 3.3%
(1) Excludes net unrealized investment gains and losses, net of tax, and reflects cash, receivables for
investment sales, payables on investment purchases and accrued investment income.
(2) Excludes net realized and unrealized investment gains and losses.
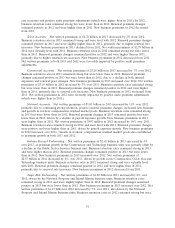
Net investment income in 2013 was $2.72 billion, $173 million or 6% lower than in 2012. Net
investment income from fixed maturity investments in 2013 was $2.31 billion in 2013, a decrease of
$129 million from 2012, primarily resulting from lower long-term reinvestment yields available in the
market. Net investment income from non-fixed maturity investments was $432 million in 2013, a
decrease of $44 million from 2012, primarily reflecting lower results from the Company’s real estate
partnership investments.
Net investment income in 2012 was $2.89 billion, $10 million or less than 1% higher than in 2011.
Net investment income from fixed maturity investments was $2.44 billion in 2012, a decrease of
$104 million from 2011, primarily resulting from lower long-term reinvestment yields available in the
market. Net investment income generated by non-fixed maturity investments was $476 million in 2012,
an increase of $121 million over 2011, primarily driven by improved results from the Company’s real
estate partnerships and hedge fund investments. On an after-tax basis, net investment income in 2012
was $14 million, or less than 1% lower than in 2011, reflecting a higher proportion of taxable net
investment income in 2012 compared with 2011.
Fee Income
The National Accounts market in the Business Insurance segment is the primary source of the
Company’s fee-based business. The $72 million and $27 million increases in fee income in 2013 and
2012, respectively, compared with the respective prior years are described in the Business Insurance
segment discussion that follows.
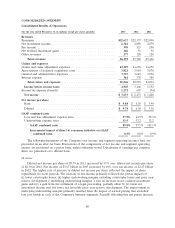
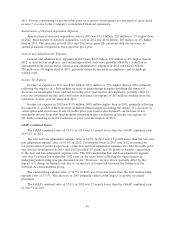
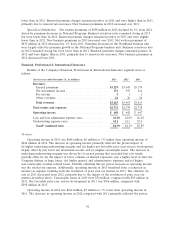
Net Realized Investment Gains
The following table sets forth information regarding the Company’s net pretax realized investment
gains.
(for the year ended December 31, in millions) 2013 2012 2011
Net Realized Investment Gains
Other-than-temporary impairment losses ............................. (15) (15) (25)
Other net realized investment gains ................................. 181 66 80
Net realized investment gains ................................... $166 $51 $55
82