Travelers 2013 Annual Report Download - page 123
Download and view the complete annual report
Please find page 123 of the 2013 Travelers annual report below. You can navigate through the pages in the report by either clicking on the pages listed below, or by using the keyword search tool below to find specific information within the annual report.-
 1
1 -
2
-
3
-
4
-
5
-
6
-
7
-
8
-
9
-
10
-
11
-
12
-
13
-
14
-
15
-
16
-
17
-
18
-
19
-
20
-
21
-
22
-
23
-
24
-
25
-
26
-
27
-
28
-
29
-
30
-
31
-
32
-
33
-
34
-
35
-
36
-
37
-
38
-
39
-
40
-
41
-
42
-
43
-
44
-
45
-
46
-
47
-
48
-
49
-
50
-
51
-
52
-
53
-
54
-
55
-
56
-
57
-
58
-
59
-
60
-
61
-
62
-
63
-
64
-
65
-
66
-
67
-
68
-
69
-
70
-
71
-
72
-
73
-
74
-
75
-
76
-
77
-
78
-
79
-
80
-
81
-
82
-
83
-
84
-
85
-
86
-
87
-
88
-
89
-
90
-
91
-
92
-
93
-
94
-
95
-
96
-
97
-
98
-
99
-
100
-
101
-
102
-
103
-
104
-
105
-
106
-
107
-
108
-
109
-
110
-
111
-
112
-
 113
113 -
 114
114 -
 115
115 -
 116
116 -
 117
117 -
 118
118 -
 119
119 -
 120
120 -
 121
121 -
 122
122 -
 123
123 -
 124
124 -
 125
125 -
 126
126 -
 127
127 -
 128
128 -
 129
129 -
 130
130 -
 131
131 -
 132
132 -
 133
133 -
134
-
135
-
136
-
137
-
138
-
139
-
140
-
141
-
142
-
143
-
144
-
145
-
146
-
147
-
148
-
149
-
150
-
151
-
152
-
153
-
154
-
155
-
156
-
157
-
158
-
159
-
160
-
161
-
162
-
163
-
164
-
165
-
166
-
167
-
168
-
169
-
170
-
171
-
172
-
173
-
174
-
175
-
176
-
177
-
178
-
179
-
180
-
181
-
182
-
183
-
184
-
185
-
186
-
187
-
188
-
189
-
190
-
191
-
192
-
193
-
194
-
195
-
196
-
197
-
198
-
199
-
200
-
201
-
202
-
203
-
204
-
205
-
206
-
207
-
208
-
209
-
210
-
211
-
212
-
213
-
214
-
215
-
216
-
217
-
218
-
219
-
220
-
221
-
222
-
223
-
224
-
225
-
226
-
227
-
228
-
229
-
230
-
231
-
232
-
233
-
234
-
235
-
236
-
237
-
238
-
239
-
240
-
241
-
242
-
243
-
244
-
245
-
246
-
247
-
248
-
249
-
250
-
251
-
252
-
253
-
254
-
255
-
256
-
257
-
258
-
259
-
260
-
261
-
262
-
263
-
264
-
265
-
266
-
267
-
268
-
269
-
270
-
271
-
272
-
273
-
274
-
275
-
276
-
277
-
278
-
279
-
280
-
281
-
282
-
283
-
284
-
285
-
286
-
287
-
288
-
289
-
290
-
291
-
292
-
293
-
294
-
295
-
296
-
297
-
298
-
299
-
300
-
301
-
302
-
303
-
304
 |
 |

Debt Securities Corporate Securities
Issued
by Foreign Sovereign
Governments Financial Corporates All Other
Average Average Average Average
Carrying Credit Carrying Credit Carrying Credit Carrying Credit
(at December 31, 2013, in millions) Value Quality(1) Value Quality(1) Value Quality(1) Value Quality(1)
Eurozone Periphery
Spain ................... $— — $11 Baa2 $ — — $ 36 Baa1
Ireland .................. —— 2A3— —54A3
Italy .................... — — — — — — 17 Ba1
Greece .................. — — — — — — 2 Baa2
Portugal ................. ——— —— ———
Subtotal ................ — 13 — 109
Eurozone Non-Periphery
Germany ................. 41 Aaa 3 Baa1 277 Aaa 256 A3
France .................. 28 Aa1 18 A2 3 Aaa/Aa1 371 A2
Netherlands .............. — — 45 A1 84 Aaa/Aa1 305 A2
Austria .................. — — — — 7 Aaa/Aa1 — —
Finland .................. 17 Aaa — — — — 13 Ba1
Belgium ................. — — — — — — 166 A3
Luxembourg .............. — — — — — — 22 Ba1
Subtotal ................ 86 66 371 1,133
Total ................ $86 $79 $371 $1,242
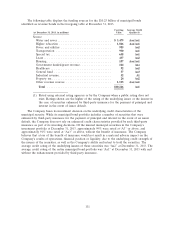
(1) Rated using external rating agencies or by the Company when a public rating does not exist. The
table includes $116 million of short-term securities which have the highest ratings issued by
external rating agencies for short-term issuances. For purposes of this table, the short-term
securities, which are rated ‘‘A-1+’’ and/or ‘‘P-1,’’ are included as ‘‘Aaa’’ rated securities.
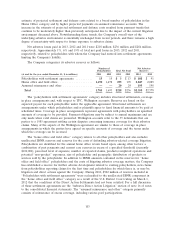
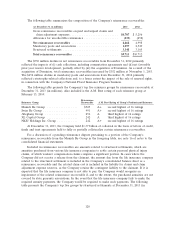
In addition to fixed maturities noted in the foregoing table, the Company has exposure totaling
$267 million to private equity limited partnerships and real estate partnerships (both of which are
included in other investments in the Company’s consolidated balance sheet) whose primary investing
focus is across Europe. The Company has unfunded commitments totaling $178 million to these
partnerships. The Company also has $5 million of nonredeemable preferred stock (included in equity
securities on the Company’s consolidated balance sheet) issued by companies in the Eurozone.
Mortgage-Backed Securities, Collateralized Mortgage Obligations and Pass-Through Securities
The Company’s fixed maturity investment portfolio at December 31, 2013 and 2012 included
$2.42 billion and $3.00 billion, respectively, of residential mortgage-backed securities, including
pass-through-securities and collateralized mortgage obligations (CMO), all of which are subject to
prepayment risk (either shortening or lengthening of duration). While prepayment risk for securities
and its effect on income cannot be fully controlled, particularly when interest rates move dramatically,
the Company’s investment strategy generally favors securities that reduce this risk within expected
interest rate ranges. Included in the totals at December 31, 2013 and 2012 were $1.06 billion and
$1.44 billion, respectively, of GNMA, FNMA and FHLMC (excluding FHA project loans) guaranteed
residential mortgage-backed pass-through securities classified as available for sale. Also included in
those totals were residential CMOs classified as available for sale with a fair value of $1.36 billion and
$1.56 billion, at December 31, 2013 and 2012, respectively. Approximately 42% and 43% of the
Company’s CMO holdings at December 31, 2013 and 2012, respectively, were guaranteed by or fully
113