Travelers 2013 Annual Report Download - page 96
Download and view the complete annual report
Please find page 96 of the 2013 Travelers annual report below. You can navigate through the pages in the report by either clicking on the pages listed below, or by using the keyword search tool below to find specific information within the annual report.-
 1
1 -
2
-
3
-
4
-
5
-
6
-
7
-
8
-
9
-
10
-
11
-
12
-
13
-
14
-
15
-
16
-
17
-
18
-
19
-
20
-
21
-
22
-
23
-
24
-
25
-
26
-
27
-
28
-
29
-
30
-
31
-
32
-
33
-
34
-
35
-
36
-
37
-
38
-
39
-
40
-
41
-
42
-
43
-
44
-
45
-
46
-
47
-
48
-
49
-
50
-
51
-
52
-
53
-
54
-
55
-
56
-
57
-
58
-
59
-
60
-
61
-
62
-
63
-
64
-
65
-
66
-
67
-
68
-
69
-
70
-
71
-
72
-
73
-
74
-
75
-
76
-
77
-
78
-
79
-
80
-
81
-
82
-
83
-
84
-
85
-
 86
86 -
 87
87 -
 88
88 -
 89
89 -
 90
90 -
 91
91 -
 92
92 -
 93
93 -
 94
94 -
 95
95 -
 96
96 -
 97
97 -
 98
98 -
 99
99 -
 100
100 -
 101
101 -
 102
102 -
 103
103 -
 104
104 -
 105
105 -
 106
106 -
107
-
108
-
109
-
110
-
111
-
112
-
113
-
114
-
115
-
116
-
117
-
118
-
119
-
120
-
121
-
122
-
123
-
124
-
125
-
126
-
127
-
128
-
129
-
130
-
131
-
132
-
133
-
134
-
135
-
136
-
137
-
138
-
139
-
140
-
141
-
142
-
143
-
144
-
145
-
146
-
147
-
148
-
149
-
150
-
151
-
152
-
153
-
154
-
155
-
156
-
157
-
158
-
159
-
160
-
161
-
162
-
163
-
164
-
165
-
166
-
167
-
168
-
169
-
170
-
171
-
172
-
173
-
174
-
175
-
176
-
177
-
178
-
179
-
180
-
181
-
182
-
183
-
184
-
185
-
186
-
187
-
188
-
189
-
190
-
191
-
192
-
193
-
194
-
195
-
196
-
197
-
198
-
199
-
200
-
201
-
202
-
203
-
204
-
205
-
206
-
207
-
208
-
209
-
210
-
211
-
212
-
213
-
214
-
215
-
216
-
217
-
218
-
219
-
220
-
221
-
222
-
223
-
224
-
225
-
226
-
227
-
228
-
229
-
230
-
231
-
232
-
233
-
234
-
235
-
236
-
237
-
238
-
239
-
240
-
241
-
242
-
243
-
244
-
245
-
246
-
247
-
248
-
249
-
250
-
251
-
252
-
253
-
254
-
255
-
256
-
257
-
258
-
259
-
260
-
261
-
262
-
263
-
264
-
265
-
266
-
267
-
268
-
269
-
270
-
271
-
272
-
273
-
274
-
275
-
276
-
277
-
278
-
279
-
280
-
281
-
282
-
283
-
284
-
285
-
286
-
287
-
288
-
289
-
290
-
291
-
292
-
293
-
294
-
295
-
296
-
297
-
298
-
299
-
300
-
301
-
302
-
303
-
304
 |
 |

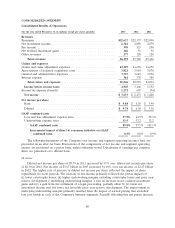
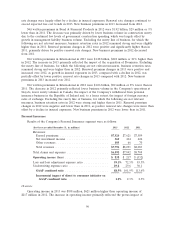
ratio on the same basis, primarily reflecting the improvement in underlying underwriting margins
discussed in the ‘‘Overview’’ section above.
The consolidated underwriting expense ratio of 31.9% in 2013 was lower than the consolidated
underwriting expense ratio of 32.2% in 2012, primarily reflecting the impact of growth in earned
premiums in 2013.
The consolidated GAAP combined ratio of 97.1% in 2012 was 8.0 points lower than the
consolidated GAAP combined ratio of 105.1% in 2011.
The consolidated loss and loss adjustment expense ratio of 64.9% in 2012 was 8.0 points lower
than the consolidated loss and loss adjustment expense ratio of 72.9% in 2011. Catastrophe losses
accounted for 8.3 points and 11.6 points of the 2012 and 2011 loss and loss adjustment expense ratios,
respectively. The 2012 and 2011 loss and loss adjustment expense ratios included 4.2 points and
3.2 points of benefit from net favorable prior year reserve development, respectively. The consolidated
2012 loss and loss adjustment expense ratio excluding catastrophe losses and prior year reserve
development (‘‘underlying loss and loss adjustment expense ratio’’) was 3.7 points lower than the 2011
ratio on the same basis, primarily reflecting the improvement in underlying underwriting margins
discussed in the ‘‘Overview’’ section above.
The consolidated underwriting expense ratio of 32.2% in 2012 was level with the consolidated
underwriting expense ratio of 32.2% in 2011.
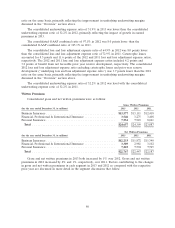
Written Premiums
Consolidated gross and net written premiums were as follows:
Gross Written Premiums
(for the year ended December 31, in millions) 2013 2012 2011
Business Insurance ........................................ $13,577 $13,111 $12,418
Financial, Professional & International Insurance .................. 3,546 3,275 3,408
Personal Insurance ........................................ 7,534 7,923 8,061
Total ................................................ $24,657 $24,309 $23,887
Net Written Premiums
(for the year ended December 31, in millions) 2013 2012 2011
Business Insurance ........................................ $12,233 $11,872 $11,340
Financial, Professional & International Insurance .................. 3,309 2,981 3,102
Personal Insurance ........................................ 7,225 7,594 7,745
Total ................................................ $22,767 $22,447 $22,187
Gross and net written premiums in 2013 both increased by 1% over 2012. Gross and net written
premiums in 2012 increased by 2% and 1%, respectively, over 2011. Factors contributing to the changes
in gross and net written premiums in each segment in 2013 and 2012 as compared with the respective
prior year are discussed in more detail in the segment discussions that follow.
86