Travelers 2013 Annual Report Download - page 120
Download and view the complete annual report
Please find page 120 of the 2013 Travelers annual report below. You can navigate through the pages in the report by either clicking on the pages listed below, or by using the keyword search tool below to find specific information within the annual report.-
 1
1 -
2
-
3
-
4
-
5
-
6
-
7
-
8
-
9
-
10
-
11
-
12
-
13
-
14
-
15
-
16
-
17
-
18
-
19
-
20
-
21
-
22
-
23
-
24
-
25
-
26
-
27
-
28
-
29
-
30
-
31
-
32
-
33
-
34
-
35
-
36
-
37
-
38
-
39
-
40
-
41
-
42
-
43
-
44
-
45
-
46
-
47
-
48
-
49
-
50
-
51
-
52
-
53
-
54
-
55
-
56
-
57
-
58
-
59
-
60
-
61
-
62
-
63
-
64
-
65
-
66
-
67
-
68
-
69
-
70
-
71
-
72
-
73
-
74
-
75
-
76
-
77
-
78
-
79
-
80
-
81
-
82
-
83
-
84
-
85
-
86
-
87
-
88
-
89
-
90
-
91
-
92
-
93
-
94
-
95
-
96
-
97
-
98
-
99
-
100
-
101
-
102
-
103
-
104
-
105
-
106
-
107
-
108
-
109
-
 110
110 -
 111
111 -
 112
112 -
 113
113 -
 114
114 -
 115
115 -
 116
116 -
 117
117 -
 118
118 -
 119
119 -
 120
120 -
 121
121 -
 122
122 -
 123
123 -
 124
124 -
 125
125 -
 126
126 -
 127
127 -
 128
128 -
 129
129 -
 130
130 -
131
-
132
-
133
-
134
-
135
-
136
-
137
-
138
-
139
-
140
-
141
-
142
-
143
-
144
-
145
-
146
-
147
-
148
-
149
-
150
-
151
-
152
-
153
-
154
-
155
-
156
-
157
-
158
-
159
-
160
-
161
-
162
-
163
-
164
-
165
-
166
-
167
-
168
-
169
-
170
-
171
-
172
-
173
-
174
-
175
-
176
-
177
-
178
-
179
-
180
-
181
-
182
-
183
-
184
-
185
-
186
-
187
-
188
-
189
-
190
-
191
-
192
-
193
-
194
-
195
-
196
-
197
-
198
-
199
-
200
-
201
-
202
-
203
-
204
-
205
-
206
-
207
-
208
-
209
-
210
-
211
-
212
-
213
-
214
-
215
-
216
-
217
-
218
-
219
-
220
-
221
-
222
-
223
-
224
-
225
-
226
-
227
-
228
-
229
-
230
-
231
-
232
-
233
-
234
-
235
-
236
-
237
-
238
-
239
-
240
-
241
-
242
-
243
-
244
-
245
-
246
-
247
-
248
-
249
-
250
-
251
-
252
-
253
-
254
-
255
-
256
-
257
-
258
-
259
-
260
-
261
-
262
-
263
-
264
-
265
-
266
-
267
-
268
-
269
-
270
-
271
-
272
-
273
-
274
-
275
-
276
-
277
-
278
-
279
-
280
-
281
-
282
-
283
-
284
-
285
-
286
-
287
-
288
-
289
-
290
-
291
-
292
-
293
-
294
-
295
-
296
-
297
-
298
-
299
-
300
-
301
-
302
-
303
-
304
 |
 |

$9.03 billion, respectively, of pre-refunded bonds, which are bonds for which states or municipalities
have established irrevocable trusts, almost exclusively comprised of U.S. Treasury securities, which were
created to satisfy their responsibility for payments of principal and interest. The irrevocable trusts are
verified as to their sufficiency by an independent verification agent of the underwriter, issuer or trustee.
In August 2013, Moody’s Investor Service revised its outlook for U.S. states to stable from negative,
and in December 2013, Moody’s revised its local government outlook to stable from negative.
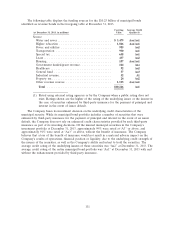
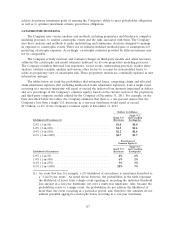
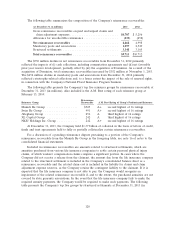
The following table shows the geographic distribution of the $26.04 billion of municipal bonds at
December 31, 2013 that were not pre-refunded.
State Local Total Average
General General Carrying Credit
(at December 31, 2013, in millions) Obligation Obligation Revenue Value Quality(1)
State:
Texas ............................... $ 390 $ 2,297 $ 1,186 $ 3,873 Aaa/Aa1
California ............................ 45 1,418 387 1,850 Aa2
Washington ........................... 244 735 518 1,497 Aa1
Virginia ............................. 144 607 720 1,471 Aaa/Aa1
Illinois .............................. 150 776 272 1,198 Aa2
Minnesota ........................... 186 725 177 1,088 Aaa/Aa1
Massachusetts ......................... 126 30 895 1,051 Aaa/Aa1
Florida .............................. 276 38 688 1,002 Aa1
North Carolina ........................ 106 605 200 911 Aaa
Arizona ............................. — 483 397 880 Aa1
Maryland ............................ 285 345 143 773 Aaa/Aa1
Colorado ............................ — 551 216 767 Aa1
Georgia ............................. 126 281 280 687 Aaa/Aa1
All others(2)(3) ........................ 1,480 3,349 4,167 8,996 Aa1
Total .............................. $3,558 $12,240 $10,246 $26,044 Aa1
(1) Rated using external rating agencies or by the Company when a public rating does not exist.
Ratings shown are the higher of the rating of the underlying issuer or the insurer in the case of
securities enhanced by third-party insurance for the payment of principal and interest in the event
of issuer default.
(2) No other single state accounted for 2.5% or more of the total non-pre-refunded municipal bonds.
(3) The Company owns $64 million of non-pre-refunded bonds issued by Puerto Rico, of which
$45 million are enhanced by third-party insurance for the payment of principal and interest in the
event of an issuer default. The Company does not own any municipal securities issued by the city
of Detroit, MI.
110