Travelers 2013 Annual Report Download - page 212
Download and view the complete annual report
Please find page 212 of the 2013 Travelers annual report below. You can navigate through the pages in the report by either clicking on the pages listed below, or by using the keyword search tool below to find specific information within the annual report.-
 1
1 -
2
-
3
-
4
-
5
-
6
-
7
-
8
-
9
-
10
-
11
-
12
-
13
-
14
-
15
-
16
-
17
-
18
-
19
-
20
-
21
-
22
-
23
-
24
-
25
-
26
-
27
-
28
-
29
-
30
-
31
-
32
-
33
-
34
-
35
-
36
-
37
-
38
-
39
-
40
-
41
-
42
-
43
-
44
-
45
-
46
-
47
-
48
-
49
-
50
-
51
-
52
-
53
-
54
-
55
-
56
-
57
-
58
-
59
-
60
-
61
-
62
-
63
-
64
-
65
-
66
-
67
-
68
-
69
-
70
-
71
-
72
-
73
-
74
-
75
-
76
-
77
-
78
-
79
-
80
-
81
-
82
-
83
-
84
-
85
-
86
-
87
-
88
-
89
-
90
-
91
-
92
-
93
-
94
-
95
-
96
-
97
-
98
-
99
-
100
-
101
-
102
-
103
-
104
-
105
-
106
-
107
-
108
-
109
-
110
-
111
-
112
-
113
-
114
-
115
-
116
-
117
-
118
-
119
-
120
-
121
-
122
-
123
-
124
-
125
-
126
-
127
-
128
-
129
-
130
-
131
-
132
-
133
-
134
-
135
-
136
-
137
-
138
-
139
-
140
-
141
-
142
-
143
-
144
-
145
-
146
-
147
-
148
-
149
-
150
-
151
-
152
-
153
-
154
-
155
-
156
-
157
-
158
-
159
-
160
-
161
-
162
-
163
-
164
-
165
-
166
-
167
-
168
-
169
-
170
-
171
-
172
-
173
-
174
-
175
-
176
-
177
-
178
-
179
-
180
-
181
-
182
-
183
-
184
-
185
-
186
-
187
-
188
-
189
-
190
-
191
-
192
-
193
-
194
-
195
-
196
-
197
-
198
-
199
-
200
-
201
-
 202
202 -
 203
203 -
 204
204 -
 205
205 -
 206
206 -
 207
207 -
 208
208 -
 209
209 -
 210
210 -
 211
211 -
 212
212 -
 213
213 -
 214
214 -
 215
215 -
 216
216 -
 217
217 -
 218
218 -
 219
219 -
 220
220 -
 221
221 -
 222
222 -
223
-
224
-
225
-
226
-
227
-
228
-
229
-
230
-
231
-
232
-
233
-
234
-
235
-
236
-
237
-
238
-
239
-
240
-
241
-
242
-
243
-
244
-
245
-
246
-
247
-
248
-
249
-
250
-
251
-
252
-
253
-
254
-
255
-
256
-
257
-
258
-
259
-
260
-
261
-
262
-
263
-
264
-
265
-
266
-
267
-
268
-
269
-
270
-
271
-
272
-
273
-
274
-
275
-
276
-
277
-
278
-
279
-
280
-
281
-
282
-
283
-
284
-
285
-
286
-
287
-
288
-
289
-
290
-
291
-
292
-
293
-
294
-
295
-
296
-
297
-
298
-
299
-
300
-
301
-
302
-
303
-
304
 |
 |

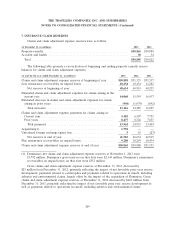
THE TRAVELERS COMPANIES, INC. AND SUBSIDIARIES
NOTES TO CONSOLIDATED FINANCIAL STATEMENTS (Continued)
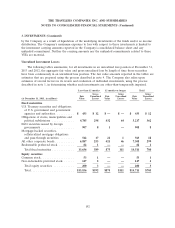
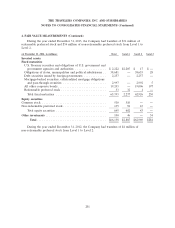
4. FAIR VALUE MEASUREMENTS (Continued)
The following tables present the changes in the Level 3 fair value category for the years ended
December 31, 2013 and 2012.
Fixed Other
(in millions) Maturities Investments Total
Balance at December 31, 2012 ............................... $230 $ 54 $284
Total realized and unrealized investment gains (losses):
Reported in net realized investment gains(1) ................... 41216
Reported in increases (decreases) in other comprehensive income .... (2) 1 (1)
Purchases, sales and settlements/maturities:
Purchases ............................................. 180 — 180
Sales ................................................ (25) (33) (58)
Settlements/maturities .................................... (83) — (83)
Gross transfers into Level 3 ................................. 15 — 15
Gross transfers out of Level 3 ............................... (64) — (64)
Balance at December 31, 2013 ............................ $255 $ 34 $289
Amount of total realized investment gains (losses) for the period
included in the consolidated statement of income attributable to
changes in the fair value of assets still held at the reporting date ..... $— $— $—
(1) Includes impairments on investments held at the end of the period as well as amortization on fixed
maturities.
Fixed Other
(in millions) Maturities Investments Total
Balance at December 31, 2011 ............................... $250 $44 $294
Total realized and unrealized investment gains (losses):
Reported in net realized investment gains(1) ................... 4 5 9
Reported in increases (decreases) in other comprehensive income .... 5 2 7
Purchases, sales and settlements/maturities:
Purchases ............................................. 79 3 82
Sales ................................................ — — —
Settlements/maturities .................................... (94) — (94)
Gross transfers into Level 3 ................................. 10 — 10
Gross transfers out of Level 3 ............................... (24) — (24)
Balance at December 31, 2012 ............................ $230 $54 $284
Amount of total realized investment gains (losses) for the period
included in the consolidated statement of income attributable to
changes in the fair value of assets still held at the reporting date ..... $ — $— $ —
(1) Includes impairments on investments held at the end of the period as well as amortization on fixed
maturities.
202