Travelers 2013 Annual Report Download - page 105
Download and view the complete annual report
Please find page 105 of the 2013 Travelers annual report below. You can navigate through the pages in the report by either clicking on the pages listed below, or by using the keyword search tool below to find specific information within the annual report.-
 1
1 -
2
-
3
-
4
-
5
-
6
-
7
-
8
-
9
-
10
-
11
-
12
-
13
-
14
-
15
-
16
-
17
-
18
-
19
-
20
-
21
-
22
-
23
-
24
-
25
-
26
-
27
-
28
-
29
-
30
-
31
-
32
-
33
-
34
-
35
-
36
-
37
-
38
-
39
-
40
-
41
-
42
-
43
-
44
-
45
-
46
-
47
-
48
-
49
-
50
-
51
-
52
-
53
-
54
-
55
-
56
-
57
-
58
-
59
-
60
-
61
-
62
-
63
-
64
-
65
-
66
-
67
-
68
-
69
-
70
-
71
-
72
-
73
-
74
-
75
-
76
-
77
-
78
-
79
-
80
-
81
-
82
-
83
-
84
-
85
-
86
-
87
-
88
-
89
-
90
-
91
-
92
-
93
-
94
-
 95
95 -
 96
96 -
 97
97 -
 98
98 -
 99
99 -
 100
100 -
 101
101 -
 102
102 -
 103
103 -
 104
104 -
 105
105 -
 106
106 -
 107
107 -
 108
108 -
 109
109 -
 110
110 -
 111
111 -
 112
112 -
 113
113 -
 114
114 -
 115
115 -
116
-
117
-
118
-
119
-
120
-
121
-
122
-
123
-
124
-
125
-
126
-
127
-
128
-
129
-
130
-
131
-
132
-
133
-
134
-
135
-
136
-
137
-
138
-
139
-
140
-
141
-
142
-
143
-
144
-
145
-
146
-
147
-
148
-
149
-
150
-
151
-
152
-
153
-
154
-
155
-
156
-
157
-
158
-
159
-
160
-
161
-
162
-
163
-
164
-
165
-
166
-
167
-
168
-
169
-
170
-
171
-
172
-
173
-
174
-
175
-
176
-
177
-
178
-
179
-
180
-
181
-
182
-
183
-
184
-
185
-
186
-
187
-
188
-
189
-
190
-
191
-
192
-
193
-
194
-
195
-
196
-
197
-
198
-
199
-
200
-
201
-
202
-
203
-
204
-
205
-
206
-
207
-
208
-
209
-
210
-
211
-
212
-
213
-
214
-
215
-
216
-
217
-
218
-
219
-
220
-
221
-
222
-
223
-
224
-
225
-
226
-
227
-
228
-
229
-
230
-
231
-
232
-
233
-
234
-
235
-
236
-
237
-
238
-
239
-
240
-
241
-
242
-
243
-
244
-
245
-
246
-
247
-
248
-
249
-
250
-
251
-
252
-
253
-
254
-
255
-
256
-
257
-
258
-
259
-
260
-
261
-
262
-
263
-
264
-
265
-
266
-
267
-
268
-
269
-
270
-
271
-
272
-
273
-
274
-
275
-
276
-
277
-
278
-
279
-
280
-
281
-
282
-
283
-
284
-
285
-
286
-
287
-
288
-
289
-
290
-
291
-
292
-
293
-
294
-
295
-
296
-
297
-
298
-
299
-
300
-
301
-
302
-
303
-
304
 |
 |

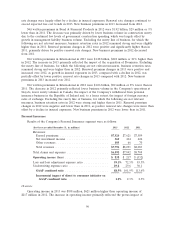
The underwriting expense ratio of 41.1% in 2013 was 0.2 points lower than the underwriting
expense ratio of 41.3% in 2012. The decrease in 2013 primarily reflected the impact of the acquisition
of Dominion, partially offset by the increases in amortization of deferred acquisition costs and general
and administrative expenses described above. Historically, Dominion has had a lower underwriting
expense ratio than the pre-existing business in the Financial, Professional & International Insurance
segment, as the underwriting expense ratio of pre-existing business reflects investment in the
Company’s International business to enhance operations, improve underwriting results and support
future business growth, as well as the business mix in Bond & Financial Products.
The GAAP combined ratio of 84.1% in 2012 was 1.7 points lower than the GAAP combined ratio
of 85.8% in 2011.
The loss and loss adjustment expense ratio of 42.8% in 2012 was 3.6 points lower than the loss and
loss adjustment expense ratio of 46.4% in 2011. The 2012 and 2011 ratios included 9.8 points and 11.3
points of benefit, respectively, from net favorable prior year reserve development. Catastrophe losses in
2012 and 2011 accounted for 1.7 points of the loss and loss adjustment expense ratio in each year. The
2012 underlying loss and loss adjustment expense ratio was 5.1 points lower than the 2011 ratio on the
same basis, reflecting the improvement in underlying underwriting margins discussed in the ‘‘Overview’’
section above.
The underwriting expense ratio of 41.3% in 2012 was 1.9 points higher than the underwriting
expense ratio of 39.4% in 2011, primarily reflecting the impact of a decline in earned premiums and, to
a lesser extent, the impact of an increase in general and administrative expenses.
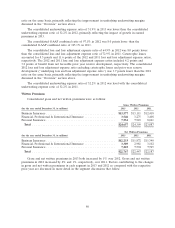
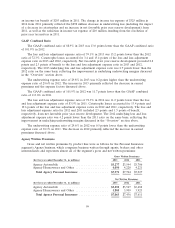
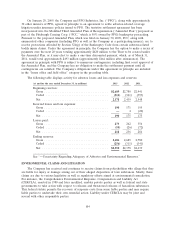
Written Premiums
Financial, Professional & International Insurance gross and net written premiums by market were
as follows:
Gross Written Premiums
(for the year ended December 31, in millions) 2013 2012 2011
Bond & Financial Products ....................... $2,131 $2,059 $2,092
International ................................. 1,415 1,216 1,316
Total Financial, Professional & International Insurance $3,546 $3,275 $3,408
Net Written Premiums
(for the year ended December 31, in millions) 2013 2012 2011
Bond & Financial Products ....................... $2,030 $1,924 $1,953
International ................................. 1,279 1,057 1,149
Total Financial, Professional & International Insurance $3,309 $2,981 $3,102
Gross and net written premiums in 2013 increased by 8% and 11%, respectively, over 2012. Gross
and net written premiums in 2012 both decreased by 4% from 2011. Renewal rate changes continued to
exceed expected loss cost trends.
Net written premiums in Bond & Financial Products in 2013 were $2.03 billion, $106 million or
6% higher than in 2012, primarily driven by higher contract surety volume, rate increases in the
management liability business and lower reinsurance costs primarily resulting from a change in a
reinsurance treaty. Excluding the surety line of business, for which the following are not relevant
measures, business retention rates in 2013 remained strong but were lower than in 2012. Renewal
premium changes in 2013 remained positive and were virtually level with 2012, as increases in renewal
95