Travelers 2013 Annual Report Download - page 175
Download and view the complete annual report
Please find page 175 of the 2013 Travelers annual report below. You can navigate through the pages in the report by either clicking on the pages listed below, or by using the keyword search tool below to find specific information within the annual report.-
 1
1 -
2
-
3
-
4
-
5
-
6
-
7
-
8
-
9
-
10
-
11
-
12
-
13
-
14
-
15
-
16
-
17
-
18
-
19
-
20
-
21
-
22
-
23
-
24
-
25
-
26
-
27
-
28
-
29
-
30
-
31
-
32
-
33
-
34
-
35
-
36
-
37
-
38
-
39
-
40
-
41
-
42
-
43
-
44
-
45
-
46
-
47
-
48
-
49
-
50
-
51
-
52
-
53
-
54
-
55
-
56
-
57
-
58
-
59
-
60
-
61
-
62
-
63
-
64
-
65
-
66
-
67
-
68
-
69
-
70
-
71
-
72
-
73
-
74
-
75
-
76
-
77
-
78
-
79
-
80
-
81
-
82
-
83
-
84
-
85
-
86
-
87
-
88
-
89
-
90
-
91
-
92
-
93
-
94
-
95
-
96
-
97
-
98
-
99
-
100
-
101
-
102
-
103
-
104
-
105
-
106
-
107
-
108
-
109
-
110
-
111
-
112
-
113
-
114
-
115
-
116
-
117
-
118
-
119
-
120
-
121
-
122
-
123
-
124
-
125
-
126
-
127
-
128
-
129
-
130
-
131
-
132
-
133
-
134
-
135
-
136
-
137
-
138
-
139
-
140
-
141
-
142
-
143
-
144
-
145
-
146
-
147
-
148
-
149
-
150
-
151
-
152
-
153
-
154
-
155
-
156
-
157
-
158
-
159
-
160
-
161
-
162
-
163
-
164
-
 165
165 -
 166
166 -
 167
167 -
 168
168 -
 169
169 -
 170
170 -
 171
171 -
 172
172 -
 173
173 -
 174
174 -
 175
175 -
 176
176 -
 177
177 -
 178
178 -
 179
179 -
 180
180 -
 181
181 -
 182
182 -
 183
183 -
 184
184 -
 185
185 -
186
-
187
-
188
-
189
-
190
-
191
-
192
-
193
-
194
-
195
-
196
-
197
-
198
-
199
-
200
-
201
-
202
-
203
-
204
-
205
-
206
-
207
-
208
-
209
-
210
-
211
-
212
-
213
-
214
-
215
-
216
-
217
-
218
-
219
-
220
-
221
-
222
-
223
-
224
-
225
-
226
-
227
-
228
-
229
-
230
-
231
-
232
-
233
-
234
-
235
-
236
-
237
-
238
-
239
-
240
-
241
-
242
-
243
-
244
-
245
-
246
-
247
-
248
-
249
-
250
-
251
-
252
-
253
-
254
-
255
-
256
-
257
-
258
-
259
-
260
-
261
-
262
-
263
-
264
-
265
-
266
-
267
-
268
-
269
-
270
-
271
-
272
-
273
-
274
-
275
-
276
-
277
-
278
-
279
-
280
-
281
-
282
-
283
-
284
-
285
-
286
-
287
-
288
-
289
-
290
-
291
-
292
-
293
-
294
-
295
-
296
-
297
-
298
-
299
-
300
-
301
-
302
-
303
-
304
 |
 |

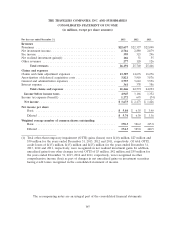
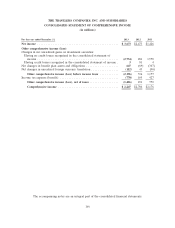
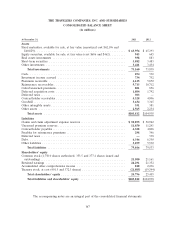
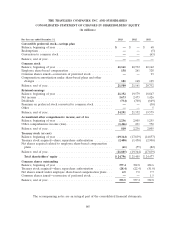
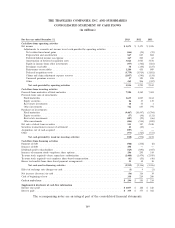
THE TRAVELERS COMPANIES, INC. AND SUBSIDIARIES
CONSOLIDATED STATEMENT OF INCOME
(in millions, except per share amounts)
For the year ended December 31, 2013 2012 2011
Revenues
Premiums .............................................. $22,637 $22,357 $22,090
Net investment income ..................................... 2,716 2,889 2,879
Fee income ............................................. 395 323 296
Net realized investment gains(1) .............................. 166 51 55
Other revenues .......................................... 277 120 126
Total revenues ...................................... 26,191 25,740 25,446
Claims and expenses
Claims and claim adjustment expenses .......................... 13,307 14,676 16,276
Amortization of deferred acquisition costs ....................... 3,821 3,910 3,876
General and administrative expenses ........................... 3,757 3,610 3,556
Interest expense .......................................... 361 378 386
Total claims and expenses ............................. 21,246 22,574 24,094
Income before income taxes ................................ 4,945 3,166 1,352
Income tax expense (benefit) ................................ 1,272 693 (74)
Net income ............................................ $ 3,673 $ 2,473 $ 1,426
Net income per share
Basic .............................................. $ 9.84 $ 6.35 $ 3.40
Diluted ............................................. $ 9.74 $ 6.30 $ 3.36
Weighted average number of common shares outstanding
Basic .............................................. 370.3 386.2 415.8
Diluted ............................................. 374.3 389.8 420.5
(1) Total other-than-temporary impairment (OTTI) gains (losses) were $(10) million, $27 million and
$30 million for the years ended December 31, 2013, 2012 and 2011, respectively. Of total OTTI,
credit losses of $(15) million, $(15) million and $(25) million for the years ended December 31,
2013, 2012 and 2011, respectively, were recognized in net realized investment gains. In addition,
unrealized gains from other changes in total OTTI of $5 million, $42 million and $55 million for
the years ended December 31, 2013, 2012 and 2011, respectively, were recognized in other
comprehensive income (loss) as part of changes in net unrealized gains on investment securities
having credit losses recognized in the consolidated statement of income.
The accompanying notes are an integral part of the consolidated financial statements.
165