Travelers 2001 Annual Report Download - page 75
Download and view the complete annual report
Please find page 75 of the 2001 Travelers annual report below. You can navigate through the pages in the report by either clicking on the pages listed below, or by using the keyword search tool below to find specific information within the annual report.-
 1
1 -
2
-
3
-
4
-
5
-
6
-
7
-
8
-
9
-
10
-
11
-
12
-
13
-
14
-
15
-
16
-
17
-
18
-
19
-
20
-
21
-
22
-
23
-
24
-
25
-
26
-
27
-
28
-
29
-
30
-
31
-
32
-
33
-
34
-
35
-
36
-
37
-
38
-
39
-
40
-
41
-
42
-
43
-
44
-
45
-
46
-
47
-
48
-
49
-
50
-
51
-
52
-
53
-
54
-
55
-
56
-
57
-
58
-
59
-
60
-
61
-
62
-
63
-
64
-
 65
65 -
 66
66 -
 67
67 -
 68
68 -
 69
69 -
 70
70 -
 71
71 -
 72
72 -
 73
73 -
 74
74 -
 75
75 -
 76
76 -
 77
77 -
 78
78 -
 79
79 -
 80
80
 |
 |

The St. Paul Companies 2001 Annual Report 73
21
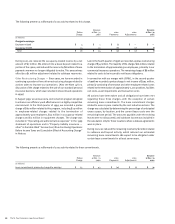
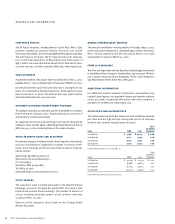
Quarterly Results of Operations (Unaudited)
The following is an unaudited summary of our quarterly results for the last two years.
First Second Third Fourth
2001 Quarter Quarter Quarter Quarter
(In millions, except per share data)
Revenues $ 2,162 $ 2,163 $ 2,230 $ 2,388
Income (loss) from continuing operations 209 96 (595) (719)
Discontinued operations (7) 8 (64) (16)
Net income (loss) 202 104 (659) (735)
Earnings per common share:
Basic:
Income (loss) from continuing operations 0.95 0.43 (2.86) (3.49)
Discontinued operations (0.04) 0.04 (0.30) (0.08)
Net income (loss) 0.91 0.47 (3.16) (3.57)
Diluted:
Income (loss) from continuing operations 0.90 0.41 (2.86) (3.49)
Discontinued operations (0.03) 0.04 (0.30) (0.08)
Net income (loss) 0.87 0.45 (3.16) (3.57)
First Second Third Fourth
2000 Quarter Quarter Quarter Quarter
(In millions, except per share data)
Revenues $ 2,143 $ 1,967 $ 1,861 $ 2,001
Income from continuing operations 349 217 219 185
Discontinued operations 9 (5) 12 7
Net income 358 212 231 192
Earnings per common share:
Basic:
Income from continuing operations 1.56 1.00 0.98 0.83
Discontinued operations 0.04 (0.02) 0.06 0.04
Net income 1.60 0.98 1.04 0.87
Diluted:
Income from continuing operations 1.47 0.94 0.93 0.80
Discontinued operations 0.04 (0.02) 0.05 0.03
Net income 1.51 0.92 0.98 0.83
Included in our fourth-quarter 2001 pretax results were $750 million in provisions to strengthen loss reserves, a $73 million goodwill
writedown (see Note 3), and a $62 million restructuring charge (see Note 16). The reserve strengthening included $600 million related to
our Health Care segment (see Note 9 for a discussion of Health Care reserves), $75 million related to the Sept. 11 terrorist attack (included
in the $941 million total pretax loss discussed in Note 2) and $75 million related to other lines of business. The fourth quarter also included
the impact of eliminating the one-quarter reporting lag for certain of our primary insurance operations in foreign countries, which resulted
in a $31 million increase to our pretax loss from continuing operations. Also impacting the quarter were $71 million of tax benefits we were
not able to recognize related to underwriting losses in international operations.