Travelers 2001 Annual Report Download - page 25
Download and view the complete annual report
Please find page 25 of the 2001 Travelers annual report below. You can navigate through the pages in the report by either clicking on the pages listed below, or by using the keyword search tool below to find specific information within the annual report.-
 1
1 -
2
-
3
-
4
-
5
-
6
-
7
-
8
-
9
-
10
-
11
-
12
-
13
-
14
-
 15
15 -
 16
16 -
 17
17 -
 18
18 -
 19
19 -
 20
20 -
 21
21 -
 22
22 -
 23
23 -
 24
24 -
 25
25 -
 26
26 -
 27
27 -
 28
28 -
 29
29 -
 30
30 -
 31
31 -
 32
32 -
 33
33 -
 34
34 -
 35
35 -
36
-
37
-
38
-
39
-
40
-
41
-
42
-
43
-
44
-
45
-
46
-
47
-
48
-
49
-
50
-
51
-
52
-
53
-
54
-
55
-
56
-
57
-
58
-
59
-
60
-
61
-
62
-
63
-
64
-
65
-
66
-
67
-
68
-
69
-
70
-
71
-
72
-
73
-
74
-
75
-
76
-
77
-
78
-
79
-
80
 |
 |

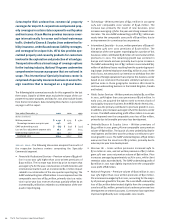
•Oil & Gas – Written premiums of $105 million in 2001 grew 82%
over 2000 written premiums of $58 million. The increase was
due to price increases, averaging 24% for the year, and new
business. The GAAP underwriting profit of $1 million in 2001 was
much improved over the 2000 loss of $4 million, primarily due
to an improvement in prior-year loss experience.
•Ocean Marine – Written premiums grew 8% in 2001 to $104 mil-
lion, driven by price increases averaging 11% during the year.
We continued to improve our book of marine business in 2001
through the non-renewal of poorly performing and inadequately
priced accounts. The GAAP underwriting profit of $19 million in
2001 was a marked improvement over the 2000 profit of $1 mil-
lion and resulted from favorable loss experience on both current
and prior-year business.
•Catastrophe Risk – Gross written premiums increased 24% to
$192 million in 2001 while net written premiums of $72 million
were 26% below total 2000 net premiums of $96 million due to a
significant increase in reinsurance purchases. The GAAP under-
writing profit declined to $44 million in 2001 from the profit of
$74 million recorded in 2000, due to the decline in earned premi-
ums associated with the increased reinsurance cessions in 2001.
•Transportation – Written premiums of $54 million in 2001 grew
33% over the 2000 premium total of $41 million, driven primarily
by price increases that averaged 24% during the year. The GAAP
underwriting loss of $25 million in 2001 was slightly better than
the 2000 loss of $30 million, primarily the result of an improve-
ment in prior-year loss experience.
The decline in segment expense ratios in both 2001 and 2000
reflected the strong increase in premium volume in both years and
the success of our aggressive expense control efforts in recent years
that have enhanced the efficiency of our underwriting, risk control
and claim operations throughout all business centers comprising
the Specialty Commercial segment.
2000 vs. 1999 – Virtually every business center in the Specialty
Commercial segment contributed to the 26% growth in written pre-
miums over 1999, but the most significant increases occurred in our
Technology and FPS business centers. Technology written premi-
ums of $346 million were 52% ahead of the comparable 1999 total,
driven by substantial new business volume, price increases aver-
aging 9.5% and a strong renewal retention rate.
In FPS, a significant increase in non-U.S. business pushed 2000
written premiums to $390 million, 41% higher than 1999’s total of
$277 million. Early in 2000, our underwriting subsidiary in the
United Kingdom was appointed by the Law Society of England and
Wales to be one of its professional indemnity insurance providers.
By year-end 2000, we had generated $65 million of FPS written
premiums from this business.
The Ocean Marine business center was the most significant con-
tributor to the improvement in results over 1999, recording an
underwriting loss that was $59 million less than 1999. The improve-
ment was largely the result of our late-1999 withdrawal from
unprofitable river transportation business in the Midwest. The
Technology business center posted an underwriting profit of
$19 million, $23 million better than the comparable 1999 result.
Favorable current and prior-year loss experience accounted for
2000’s profitable performance. The FPS underwriting loss was $43
million worse than 1999, primarily due to adverse prior-year loss
development in our U.S. operations and an increase in losses in our
international operations.
2002 Outlook – Profitable growth and prudent risk selection will be
our priorities in 2002 in the Specialty Commercial segment. With
our withdrawal from most international markets announced at the
end of 2001, we enter 2002 with a renewed focus on the U.S.
domestic commercial marketplace. Our specialty focus in recent
years has built a platform from which we can respond quickly to
emerging customer needs in that marketplace. We intend to under-
write only that business priced at levels commensurate with our
return on equity targets.
primary insurance operations
Commercial Lines Group
The Commercial Lines Group segment includes the Small
Commercial business center, which serves small busi-
nesses, such as retailers, wholesalers, service companies,
professional offices, manufacturers and contractors; the
Middle Market Commercial business center, which pro-
vides comprehensive property and liability insurance for
a wide variety of commercial manufacturing, distribut-
ing, retailing and property ownership enterprises where
annual insurance costs range from $75,000 to $1 million;
and our Large Accounts business center, which offers
insurance programs to larger commercial businesses
who are willing to share in their insurance risk through
significant deductibles and self-insured retentions. The
Commercial Lines Group segment also includes the
results of our limited involvement in insurance pools.
The St. Paul Companies 2001 Annual Report 23