Travelers 2001 Annual Report Download - page 30
Download and view the complete annual report
Please find page 30 of the 2001 Travelers annual report below. You can navigate through the pages in the report by either clicking on the pages listed below, or by using the keyword search tool below to find specific information within the annual report.-
 1
1 -
2
-
3
-
4
-
5
-
6
-
7
-
8
-
9
-
10
-
11
-
12
-
13
-
14
-
15
-
16
-
17
-
18
-
19
-
 20
20 -
 21
21 -
 22
22 -
 23
23 -
 24
24 -
 25
25 -
 26
26 -
 27
27 -
 28
28 -
 29
29 -
 30
30 -
 31
31 -
 32
32 -
 33
33 -
 34
34 -
 35
35 -
 36
36 -
 37
37 -
 38
38 -
 39
39 -
 40
40 -
41
-
42
-
43
-
44
-
45
-
46
-
47
-
48
-
49
-
50
-
51
-
52
-
53
-
54
-
55
-
56
-
57
-
58
-
59
-
60
-
61
-
62
-
63
-
64
-
65
-
66
-
67
-
68
-
69
-
70
-
71
-
72
-
73
-
74
-
75
-
76
-
77
-
78
-
79
-
80
 |
 |

reinsurance
St. Paul Re
Our Reinsurance segment, St. Paul Re, underwrites
traditional treaty and facultative reinsurance for prop-
erty, liability, ocean marine, surety and certain specialty
classes of coverage for leading property-liability
insurance companies worldwide. St. Paul Re also under-
writes certain types of “non-traditional” reinsurance,
which provides limited traditional underwriting risk
combined with financial risk protection. As discussed
on page 14 of this report, we announced in late 2001 that
we would cease underwriting certain types of reinsur-
ance coverages in 2002.
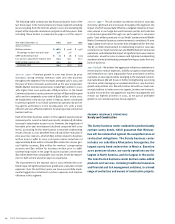
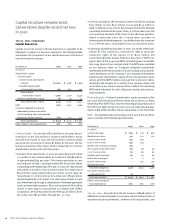
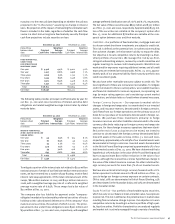
The following table summarizes results for this segment for the last
three years. Data for all three years exclude the impact of the rein-
surance treaties, and data for 2001 exclude the impact of the
terrorist attack. Data including these factors is presented on page
21 of this report.
Year ended December 31 2001 2000 1999
(Dollars in millions)
Written premiums $1,593 $ 1,211 $ 1,068
Percentage increase over prior year 32% 13%
GAAP underwriting result $ (268) $ (242) $ (87)
Loss and loss adjustment expense ratio 85.3 85.4 79.1
Underwriting expense ratio 32.2 35.3 30.0
Combined ratio 117.5 120.7 109.1
2001 vs. 2000 – The increase in written premiums in 2001 was
driven by new business growth in St. Paul Re’s North American
casualty and property lines and strong price increases across vir-
tually all lines of business. The pace of price increases continued
to grow in 2001, and those increases accelerated in the fourth quar-
ter in the aftermath of the terrorist attack. The deterioration in
underwriting results in 2001 occurred throughout our reinsurance
operations. In our North American casualty business, losses were
concentrated in large commercial program reinsurance. For North
American property business, an increase in the frequency and
severity of losses was the primary factor driving the deterioration
from 2000. We also experienced deterioration in satellite and avia-
tion loss experience in 2001. Catastrophe losses (excluding the
terrorist attack) totaled $66 million in the Reinsurance segment in
2001, driven by losses from the explosion of a chemical plant in
Toulouse, France and Tropical Storm Allison in the U.S. Reinsurance
catastrophe losses in 2000 totaled $135 million.
2000 vs. 1999 – Premium growth in 2000 was driven by new busi-
ness opportunities in the non-traditional reinsurance market and
significant price increases across virtually all lines of traditional
reinsurance coverages. Non-traditional business accounted for $142
million of St. Paul Re’s premium growth over 1999. In addition, price
increases and new business fueled an $84 million increase in North
American casualty premium volume in 2000.
The deterioration in underwriting results was due to significant
adverse loss development from years prior to 2000. Catastrophe
losses incurred in 2000 totaled $135 million, of which $115 million
represented additional losses on events occurring in 1999 and prior
years. Flooding in the United Kingdom, which accounted for $20
million in losses, was the only major event in 2000 contributing to
the 2000 catastrophe total. Adverse prior-year loss development
on retrocessional business written in St. Paul Re’s London opera-
tions also played a significant role in 2000’s underwriting loss. In
addition, our North American casualty business accounted for
$130 million of underwriting losses in 2000.
During 2000, St. Paul Re reduced its estimate of ultimate losses on
certain non-traditional reinsurance business by $56 million, and
made a corresponding increase in its estimate of reserves for con-
tingent commissions by $66 million. Although these changes in
estimate did not have a significant impact on underwriting results
for the year, they did distort the components of the combined ratio
in the table above. Excluding these changes, the loss ratio would
have been 89.8, and the expense ratio would have been 29.8 (both
excluding the benefits of the reinsurance treaties).
2002 Outlook – In December 2001, we announced plans to restruc-
ture our reinsurance segment. We intend to reduce the scale of our
business to lessen the volatility in our reported results, and focus
on established lines of business in which we have a consistently
successful track record. We will close branch offices in several for-
eign locations. We will continue to write the following lines of
business: property catastrophe; excess-of-loss casualty; marine;
and certain non-traditional reinsurance. In addition, we will write
selected other classes of business on an opportunistic basis when
we believe pricing and terms to be acceptable. Price increases on
reinsurance coverages continue to accelerate. Most of the reinsur-
ance business we underwrite renews on Jan. 1, and the business we
recorded on Jan. 1, 2002 renewals reflected average price increases
of 35%. We believe improving market conditions in 2002 provide
the opportunity for profitable growth in those lines of business
where we are focusing our efforts.
The St. Paul Companies 2001 Annual Report28