Travelers 2001 Annual Report Download - page 34
Download and view the complete annual report
Please find page 34 of the 2001 Travelers annual report below. You can navigate through the pages in the report by either clicking on the pages listed below, or by using the keyword search tool below to find specific information within the annual report.-
 1
1 -
2
-
3
-
4
-
5
-
6
-
7
-
8
-
9
-
10
-
11
-
12
-
13
-
14
-
15
-
16
-
17
-
18
-
19
-
20
-
21
-
22
-
23
-
 24
24 -
 25
25 -
 26
26 -
 27
27 -
 28
28 -
 29
29 -
 30
30 -
 31
31 -
 32
32 -
 33
33 -
 34
34 -
 35
35 -
 36
36 -
 37
37 -
 38
38 -
 39
39 -
 40
40 -
 41
41 -
 42
42 -
 43
43 -
 44
44 -
45
-
46
-
47
-
48
-
49
-
50
-
51
-
52
-
53
-
54
-
55
-
56
-
57
-
58
-
59
-
60
-
61
-
62
-
63
-
64
-
65
-
66
-
67
-
68
-
69
-
70
-
71
-
72
-
73
-
74
-
75
-
76
-
77
-
78
-
79
-
80
 |
 |

2001 2000 1999
Gross Net Gross Net Gross Net
(In millions)
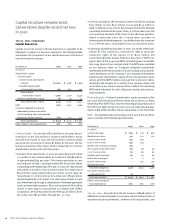
environmental
Beginning reserves $ 665 $ 563 $ 698 $ 599 $ 783 $ 645
Incurred losses 118 25 14 (33) 1
Paid losses (84) (74) (58) (50) (52) (47)
Ending reserves $582 $507 $ 665 $ 563 $ 698 $ 599
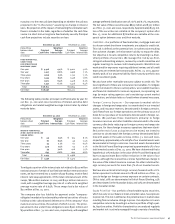
The following table represents a reconciliation of total gross and
net reserve development for asbestos claims for each of the years in
the three-year period ended Dec. 31, 2001. Amounts in the “net”
column are reduced by reinsurance recoverables.
2001 2000 1999
Gross Net Gross Net Gross Net
(In millions)
asbestos
Beginning reserves $ 397 $ 299 $ 398 $ 298 $ 402 $ 277
Incurred losses 133 110 41 33 28 51
Paid losses (52) (42) (42) (32) (32) (30)
Ending reserves $478 $367 $ 397 $ 299 $ 398 $ 298
Our reserves for environmental and asbestos losses at Dec. 31, 2001
represent our estimate of our ultimate liability for such losses,
based on all information currently available to us. Because of the
inherent difficulty in estimating such losses, however, we cannot
give assurances that our ultimate liability for environmental and
asbestos losses will, in fact, match our current reserves. We con-
tinue to evaluate new information and developing loss patterns. We
believe any future additional loss provisions for, or settlement of,
environmental and asbestos claims will not materially impact our
financial position, but may materially impact our results of opera-
tions or liquidity in the period in which such provisions or
settlements occur.
In 2001, we completed a periodic analysis of environmental and
asbestos reserves at one of our subsidiaries in the United Kingdom.
The analysis was based on a policy-by-policy review of our known
and unknown exposure to damages arising from environmental pol-
lution and asbestos litigation. The analysis concluded that loss
experience for environmental exposures was developing more
favorably than anticipated, while loss experience for asbestos expo-
sures was developing less favorably than anticipated. The
divergence in loss experience had an offsetting impact on respec-
tive reserves for environmental and asbestos exposures; as a result,
we recorded a $48 million reduction in net incurred environmental
losses in 2001, and an increase in net incurred asbestos losses for
the same amount.
Total gross environmental and asbestos reserves at Dec. 31, 2001
of $1.06 billion represented approximately 5% of gross consolidated
reserves of $22.1 billion.
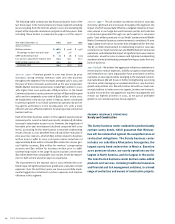
Record sales and strong asset growth
lead to Nuveen’s seventh consecutive
year of record earnings
ASSET MANAGEMENT
The John Nuveen Company
We hold a 77% interest in The John Nuveen Company
(“Nuveen”), which constitutes our asset management
segment. Nuveen’s core businesses are asset manage-
ment, and the development, marketing and distribution
of investment products and services for the affluent,
high net worth and institutional market segments.
Nuveen distributes its investment products and services,
including mutual funds, exchange-traded funds, defined
portfolios and individually managed accounts, to the
affluent and high net worth market segments through
unaffiliated intermediary firms including broker-deal-
ers, commercial banks, affiliates of insurance providers,
financial planners, accountants, consultants and invest-
ment advisors. Nuveen provides investment products
and services directly to the institutional market. The
Company markets its capabilities under three distinct
brands: Nuveen, a leader in tax-free investments;
Rittenhouse, a retail managed account service platform;
and Symphony, a leading institutional manager of
market-neutral and other investment portfolios. Nuveen
is listed on the New York Stock Exchange, trading under
the symbol “JNC.”
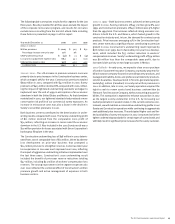
The following table summarizes Nuveen’s key financial data for the
last three years.
Year ended December 31 2001 2000 1999
(In millions)
Revenues $378 $ 376 $ 353
Expenses 190 201 193
Pretax income 188 175 160
Minority interest (46) (40) (37)
The St. Paul’s share of pretax income $142 $135 $123
Assets under management $68,485 $ 62,011 $59,784
The St. Paul Companies 2001 Annual Report32